Use it
To use NaView in your website, all you need to do is include the following libraries in your project:
<script src="https://cdnjs.cloudflare.com/ajax/libs/d3/5.16.0/d3.min.js"></script>
<script src="https://cdn.jsdelivr.net/gh/marceloqla/NaView@1.1/public/js/naview.min.js"></script>
To draw the image, you need to create a NaView object passing a JSON settings argument, as can be seen in the example below. The protein input must be a UniProtKb sequence in the text format (i.e. P14555).
fetch("https://www.uniprot.org/uniprot/P14555.txt")
    .then(response => response.text())
    .then(data => {
    var naview = new NaView({
    	"protein_input":data,
        "container_id": "result",
        "svg_width": 800
    });
});
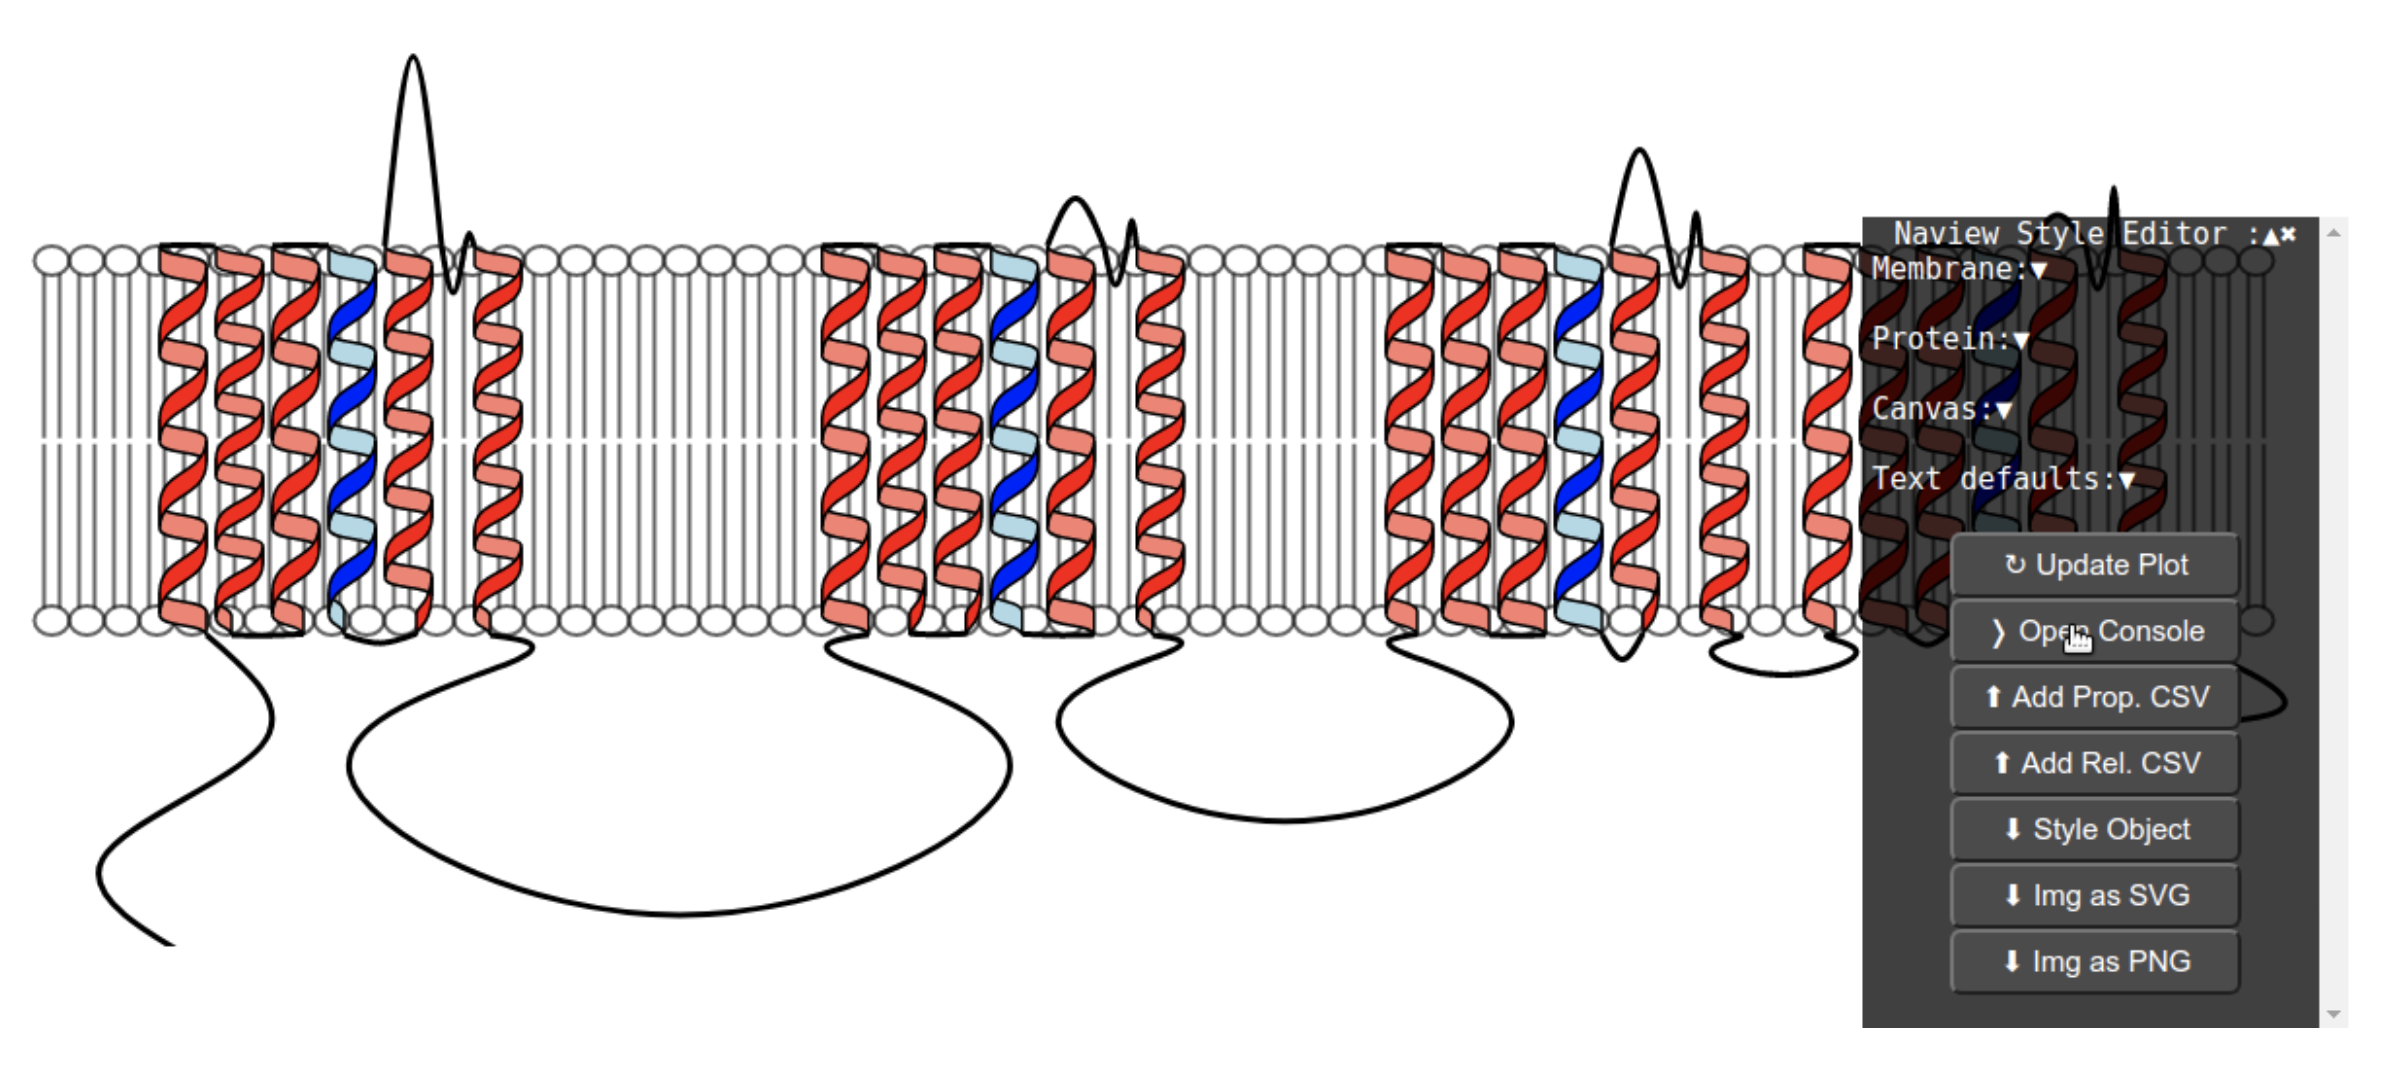
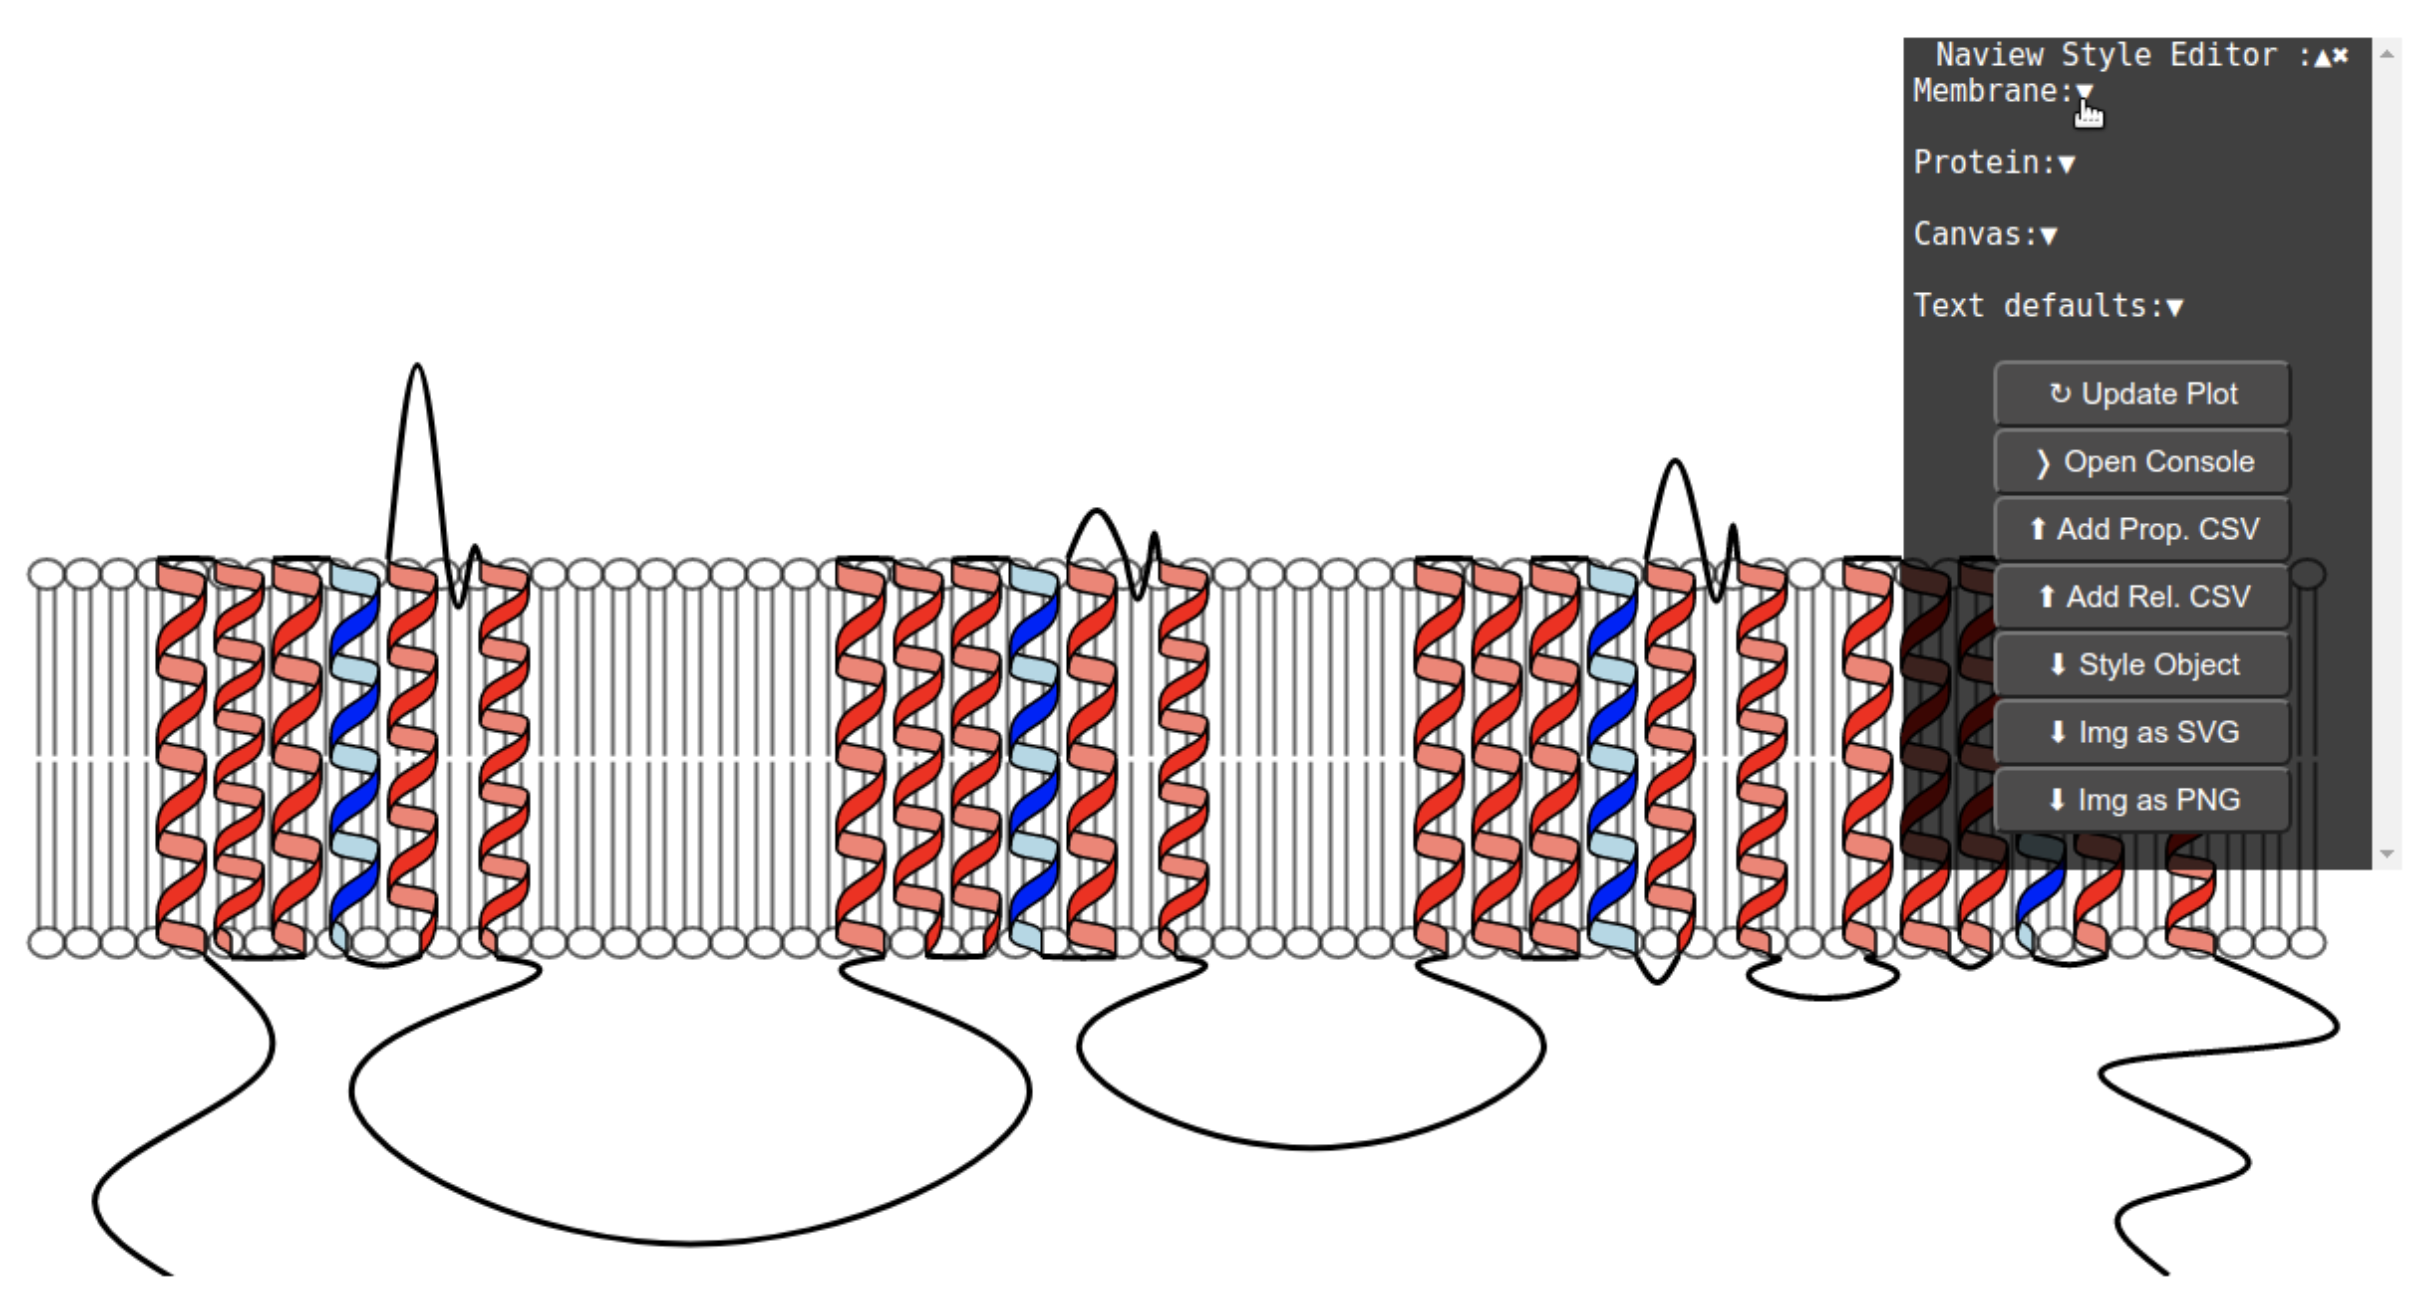
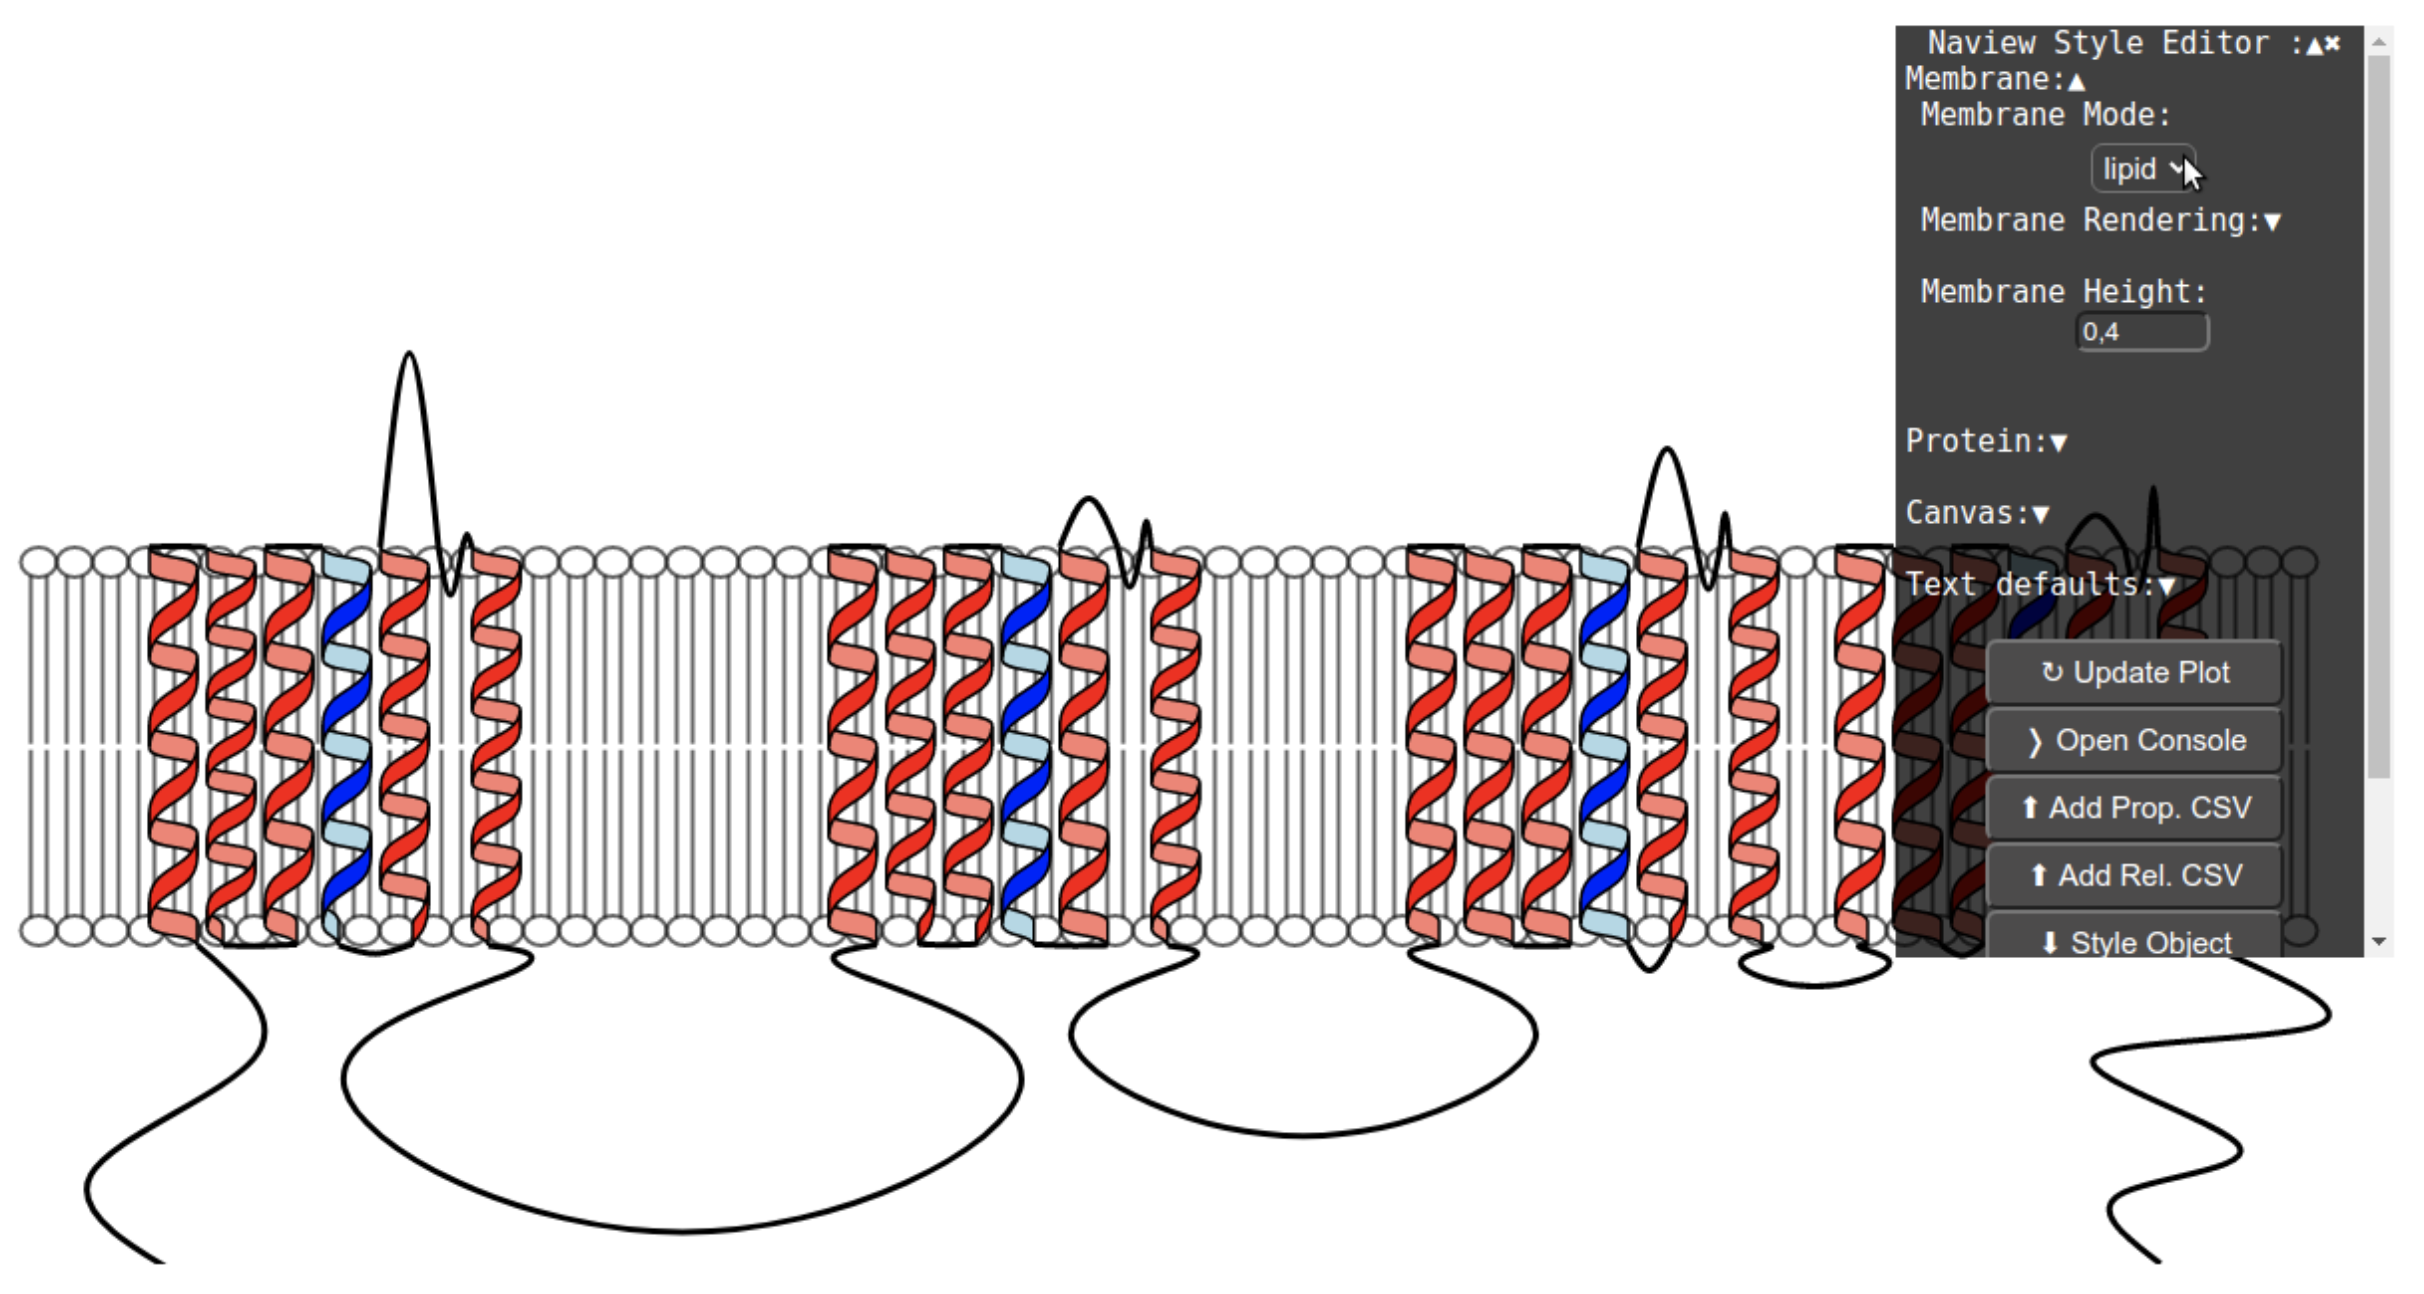
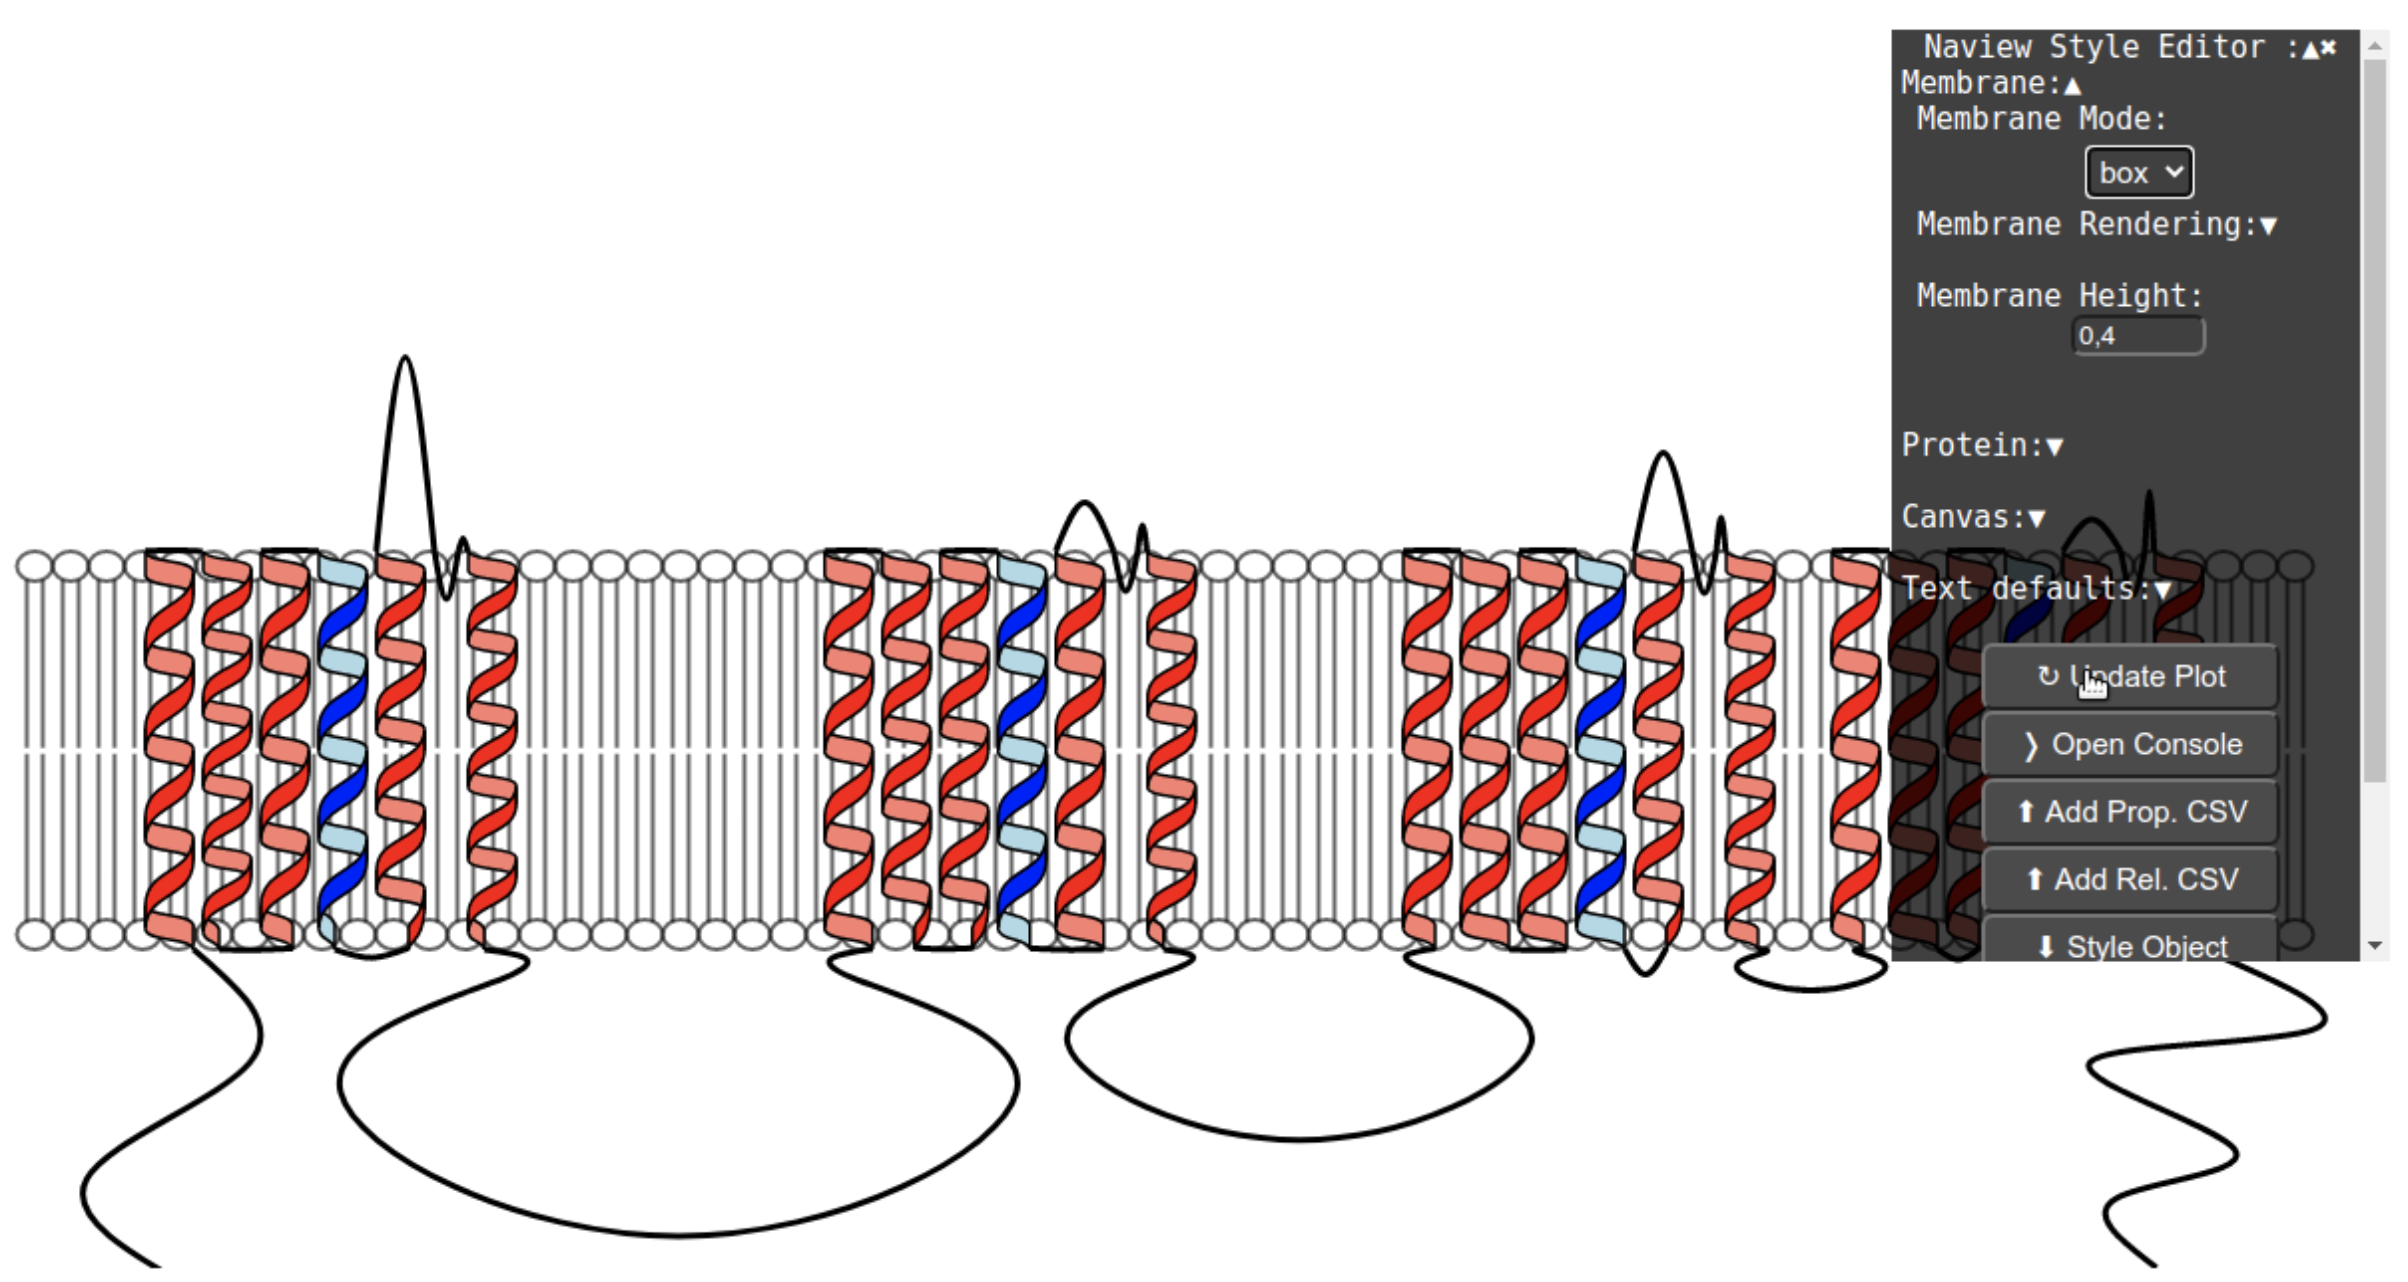
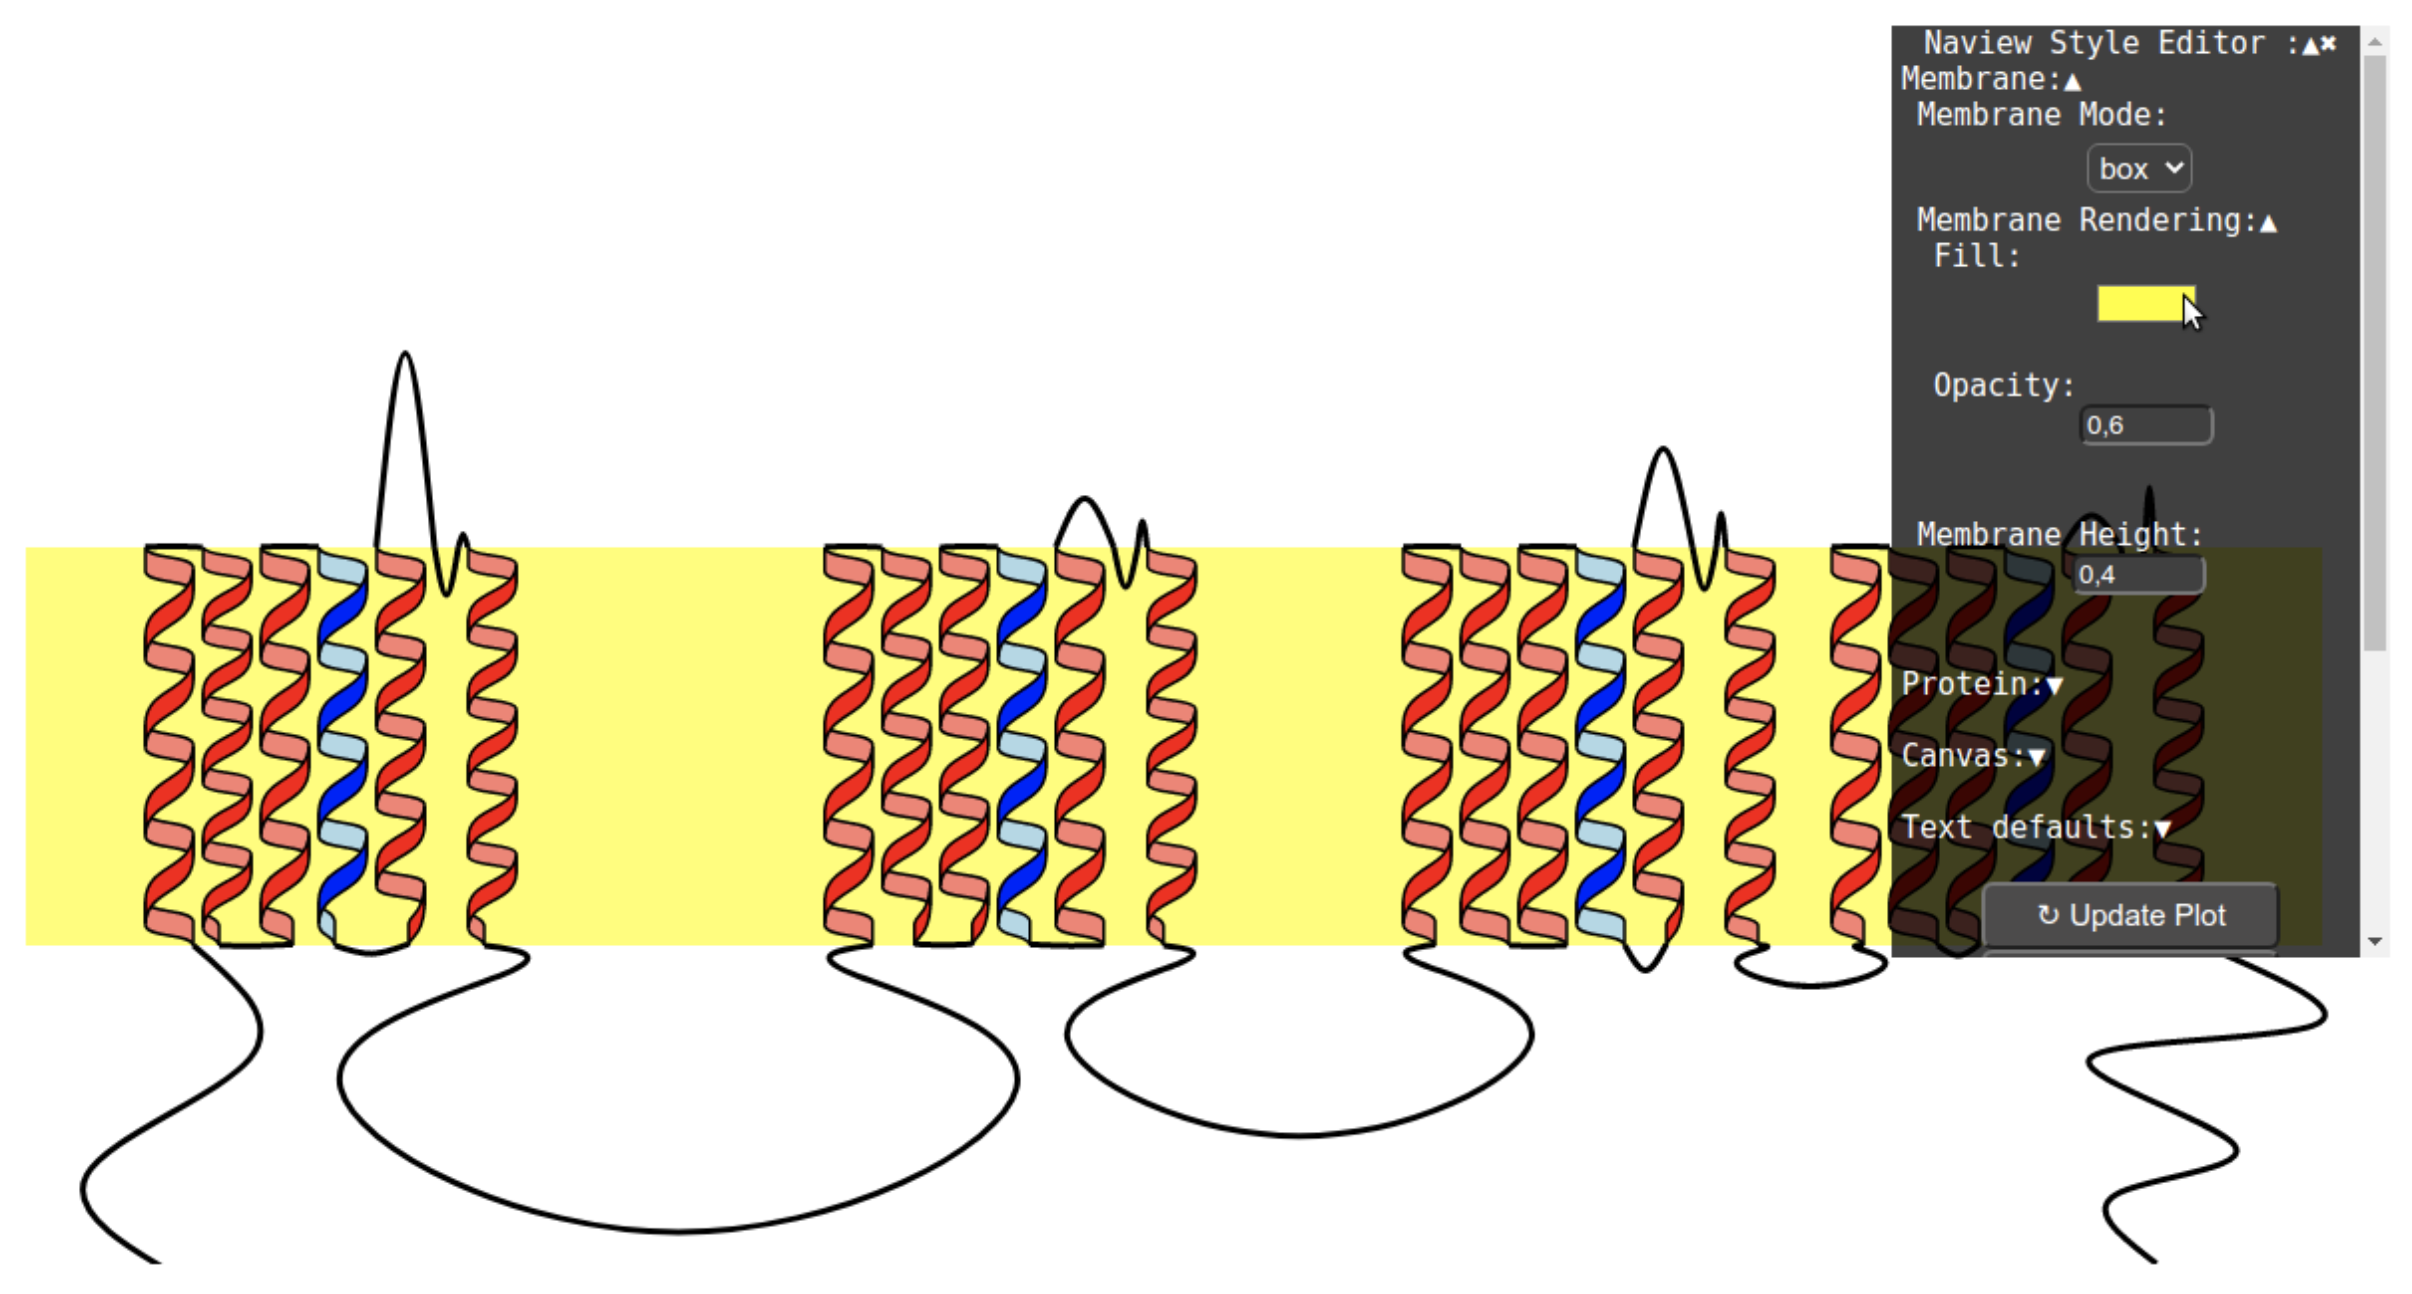
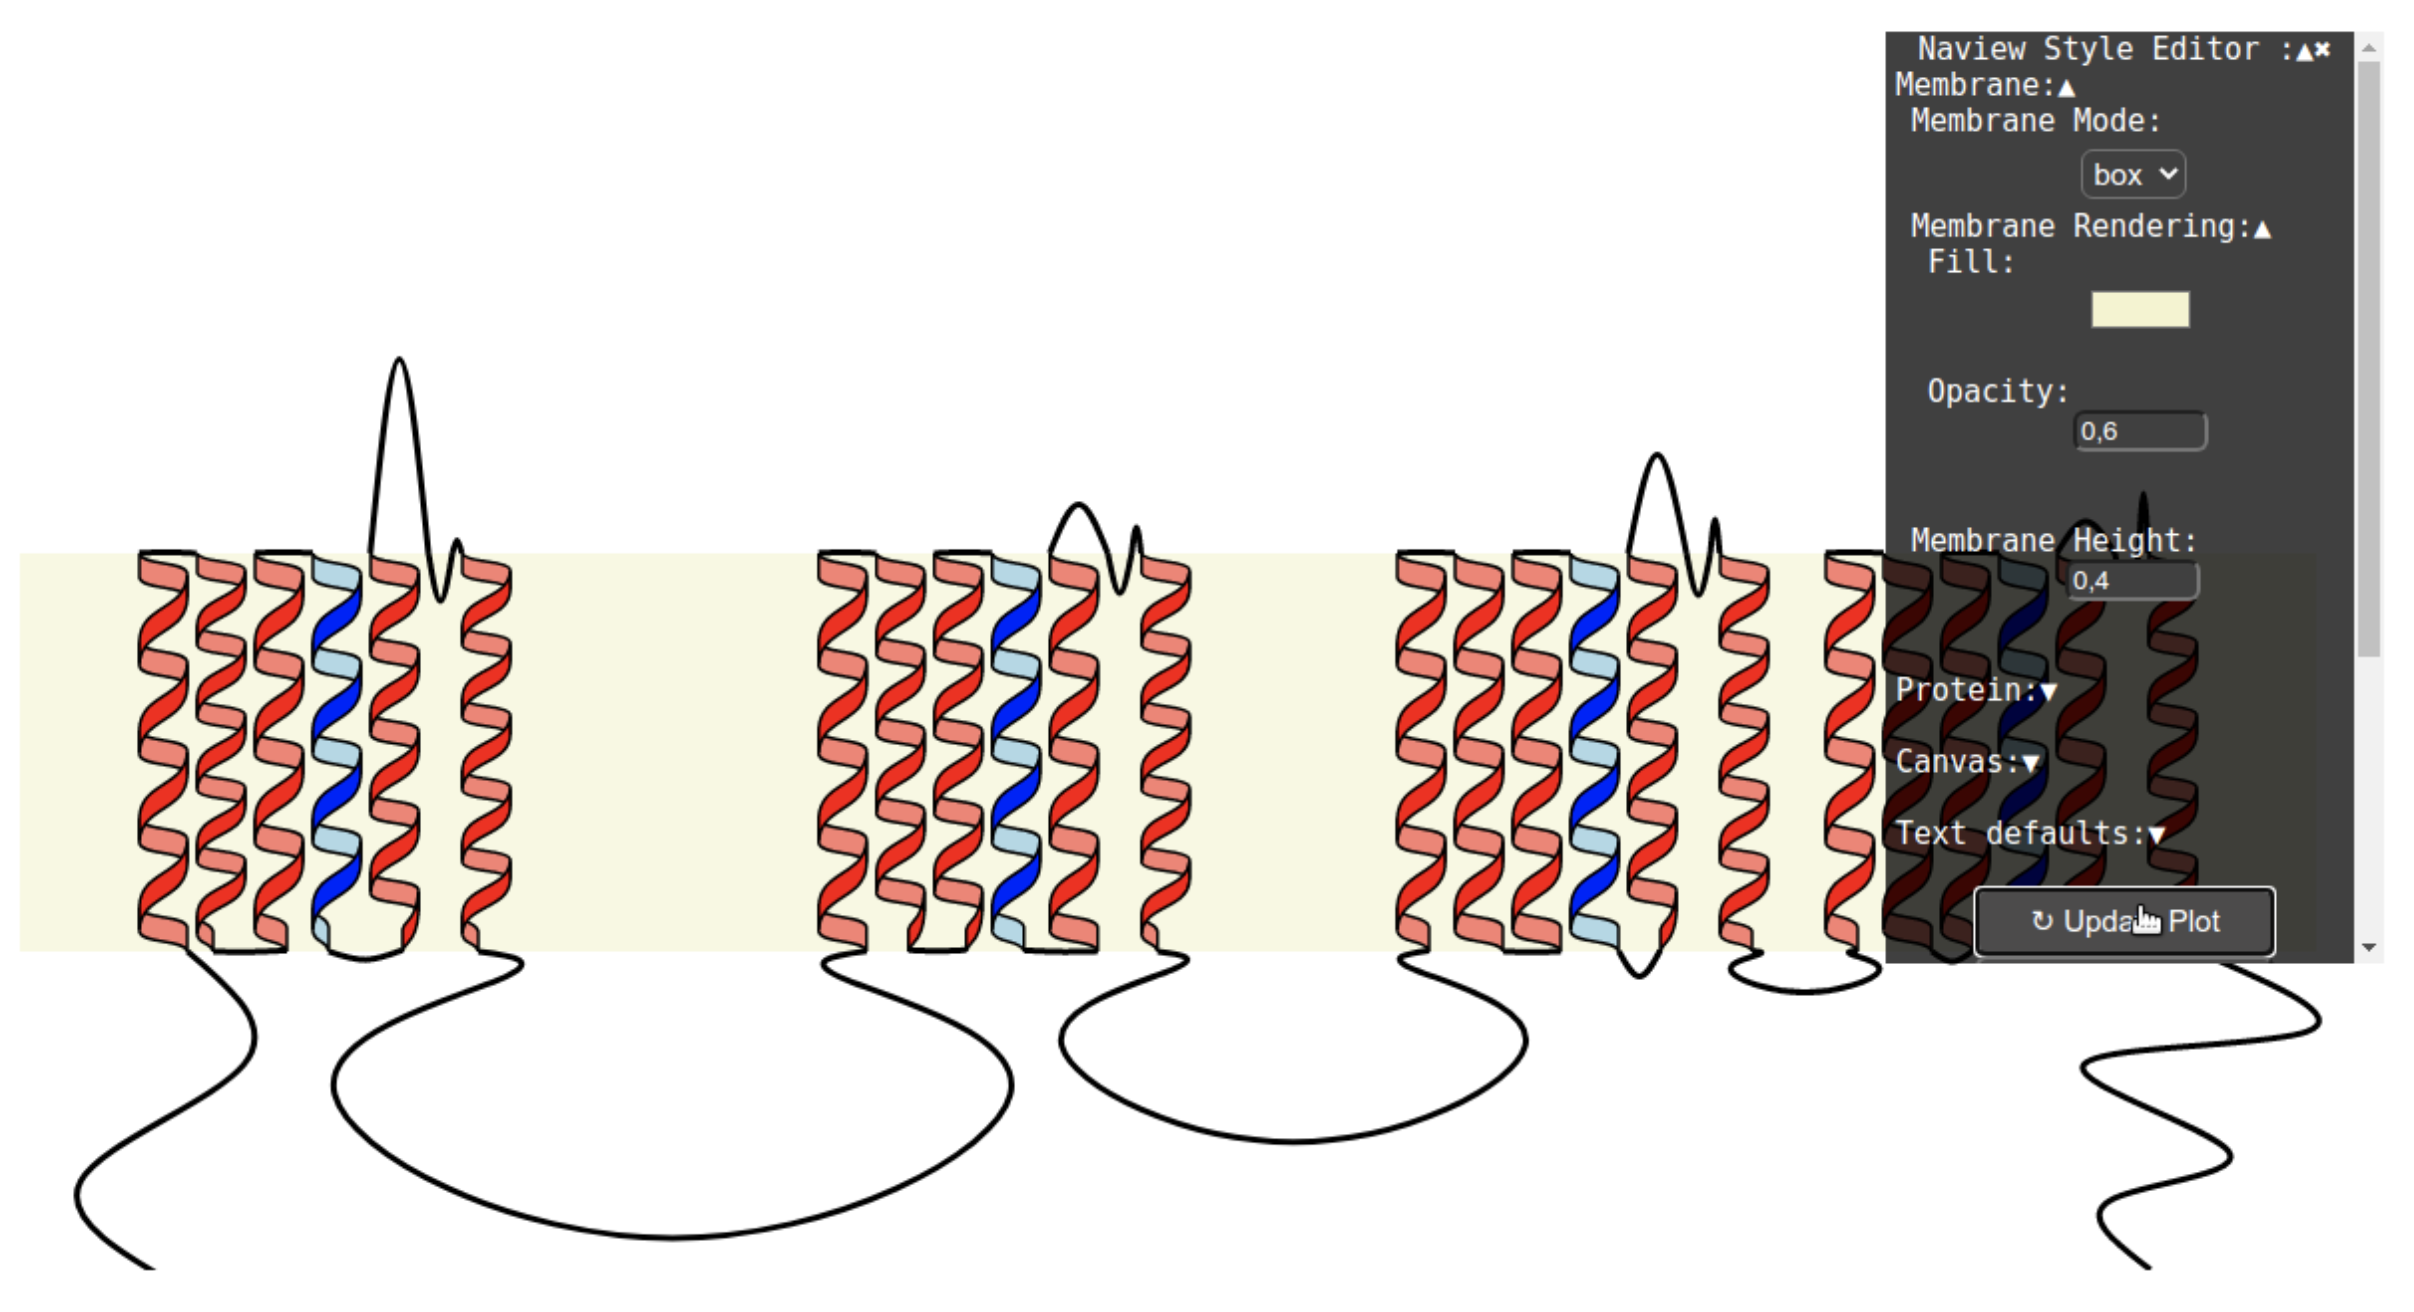
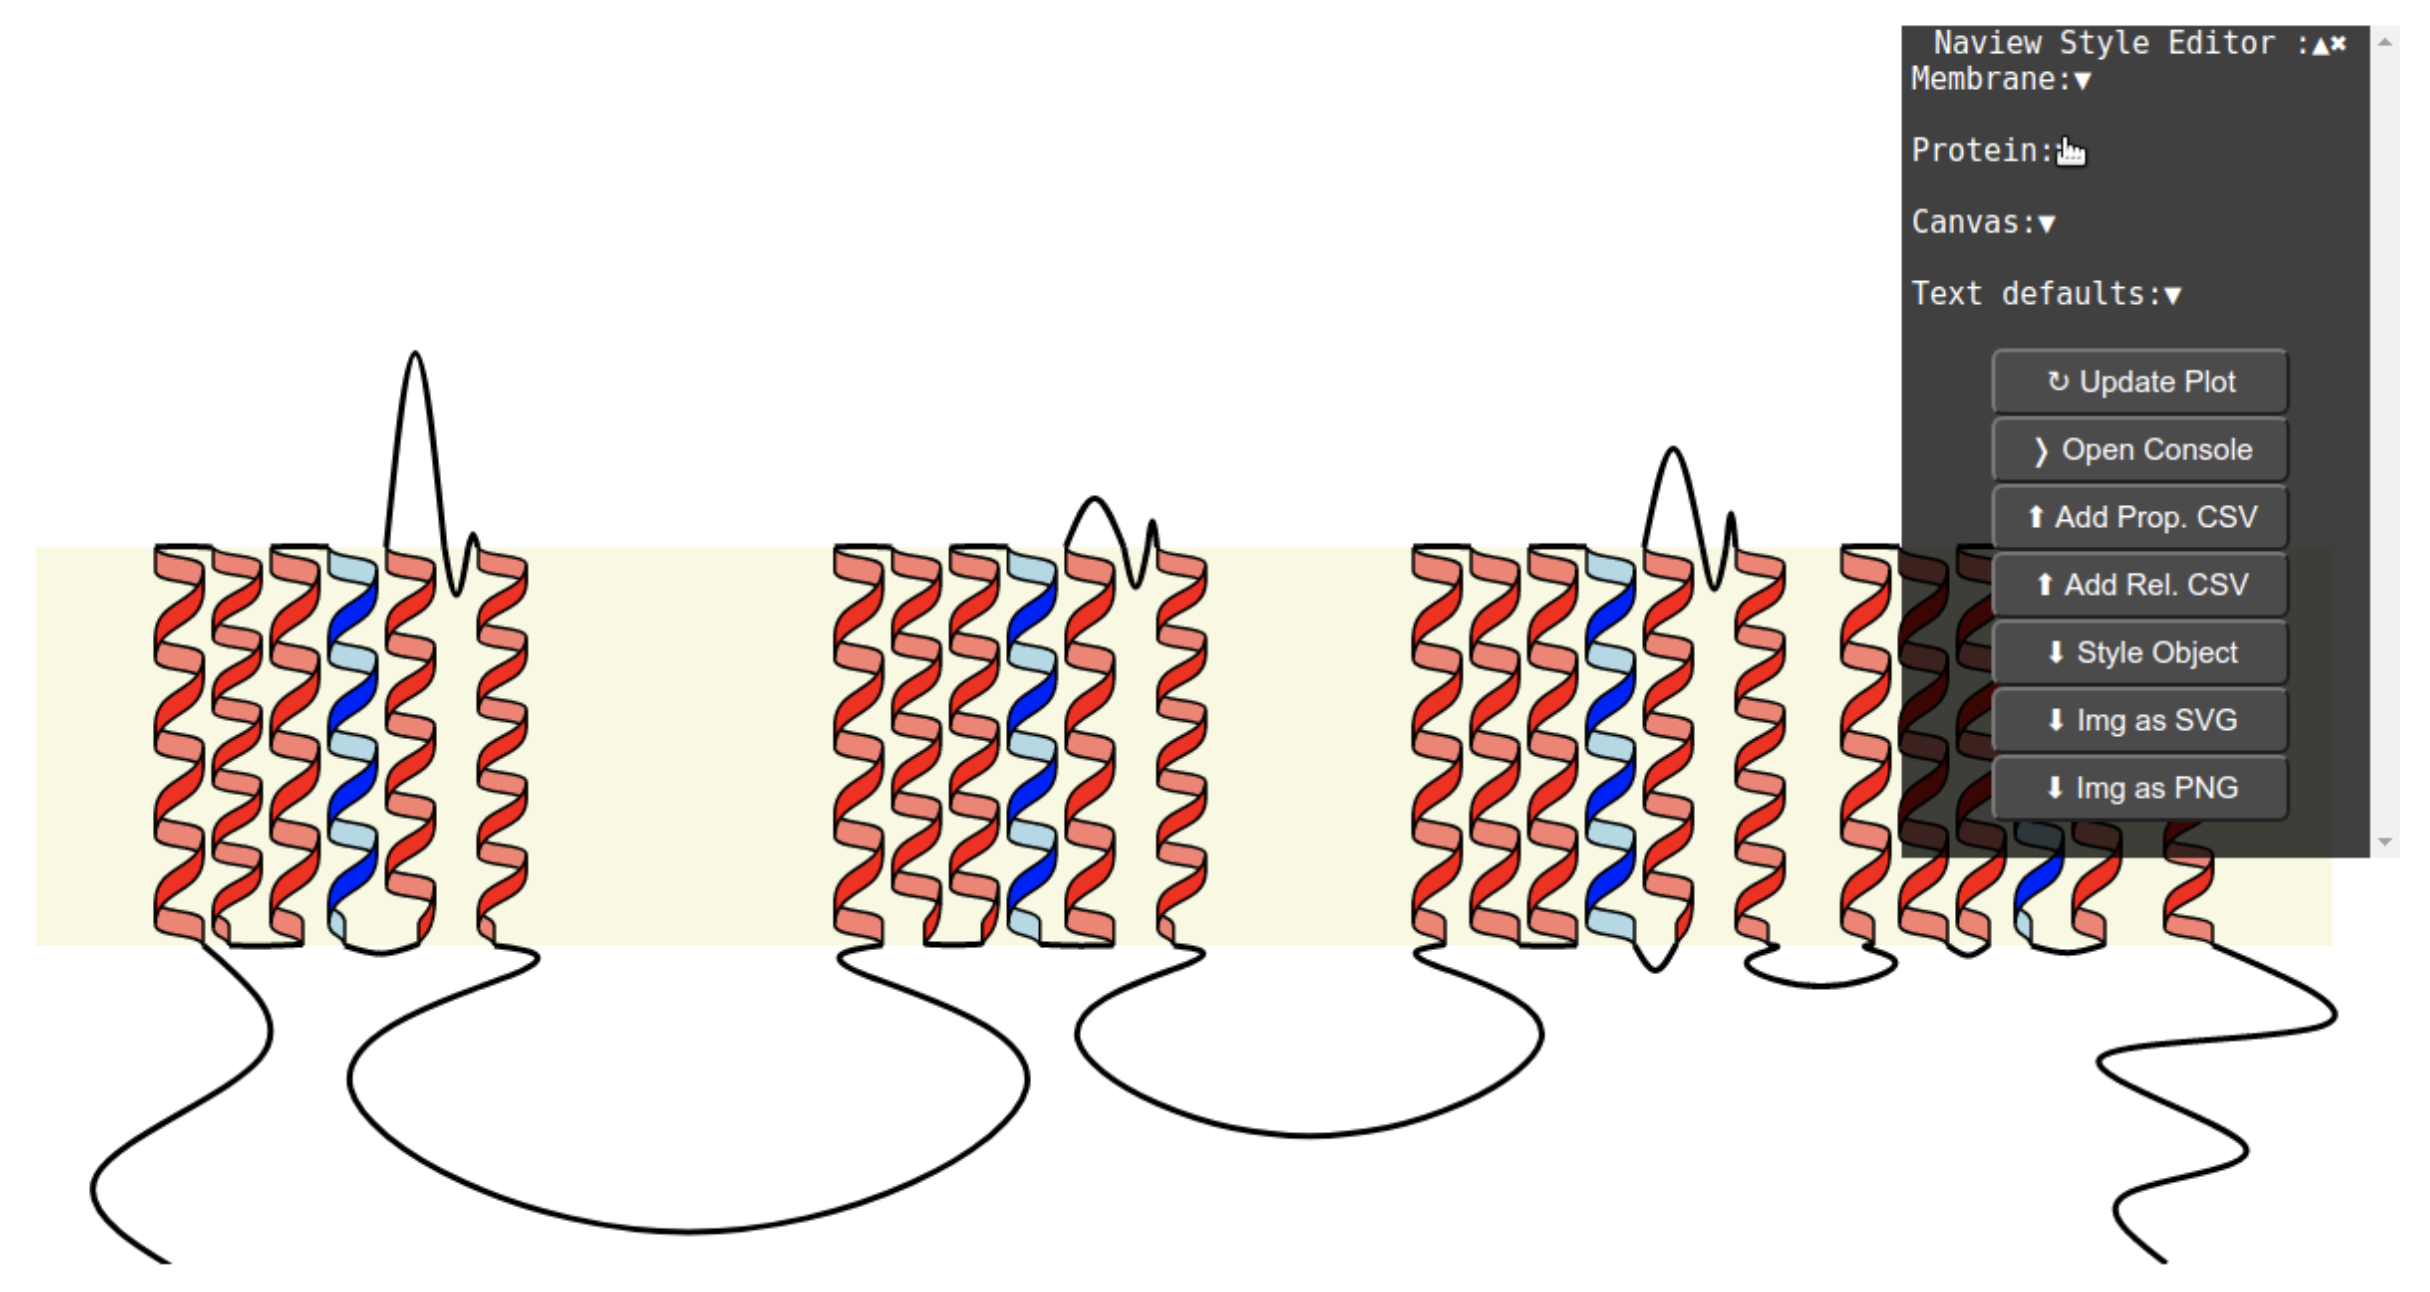
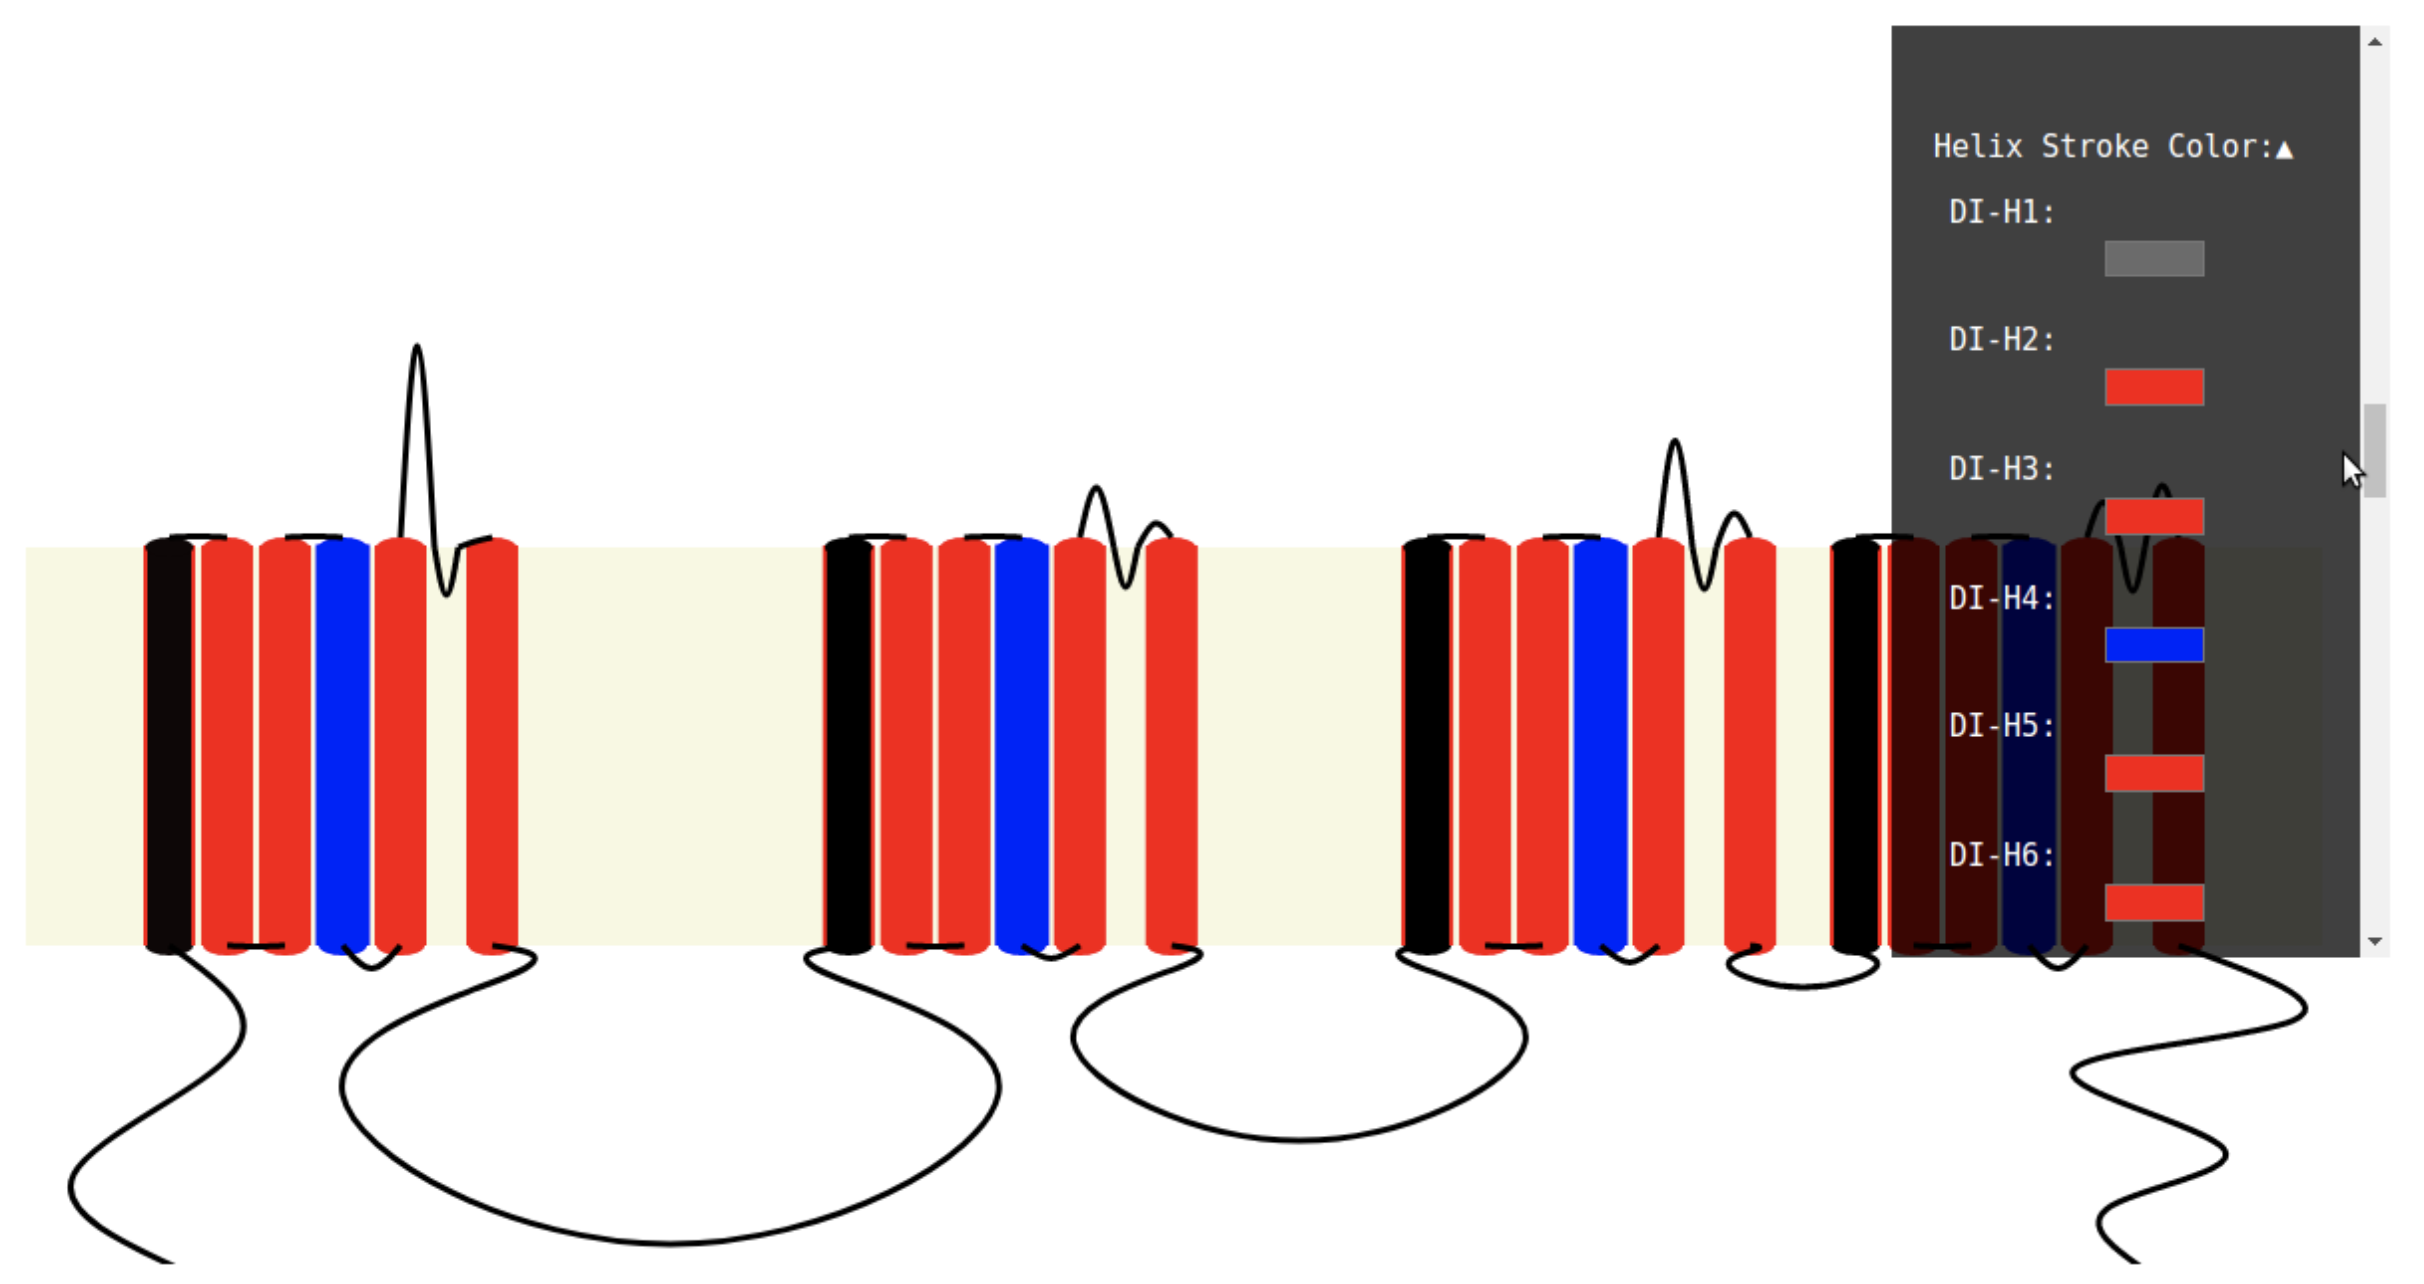
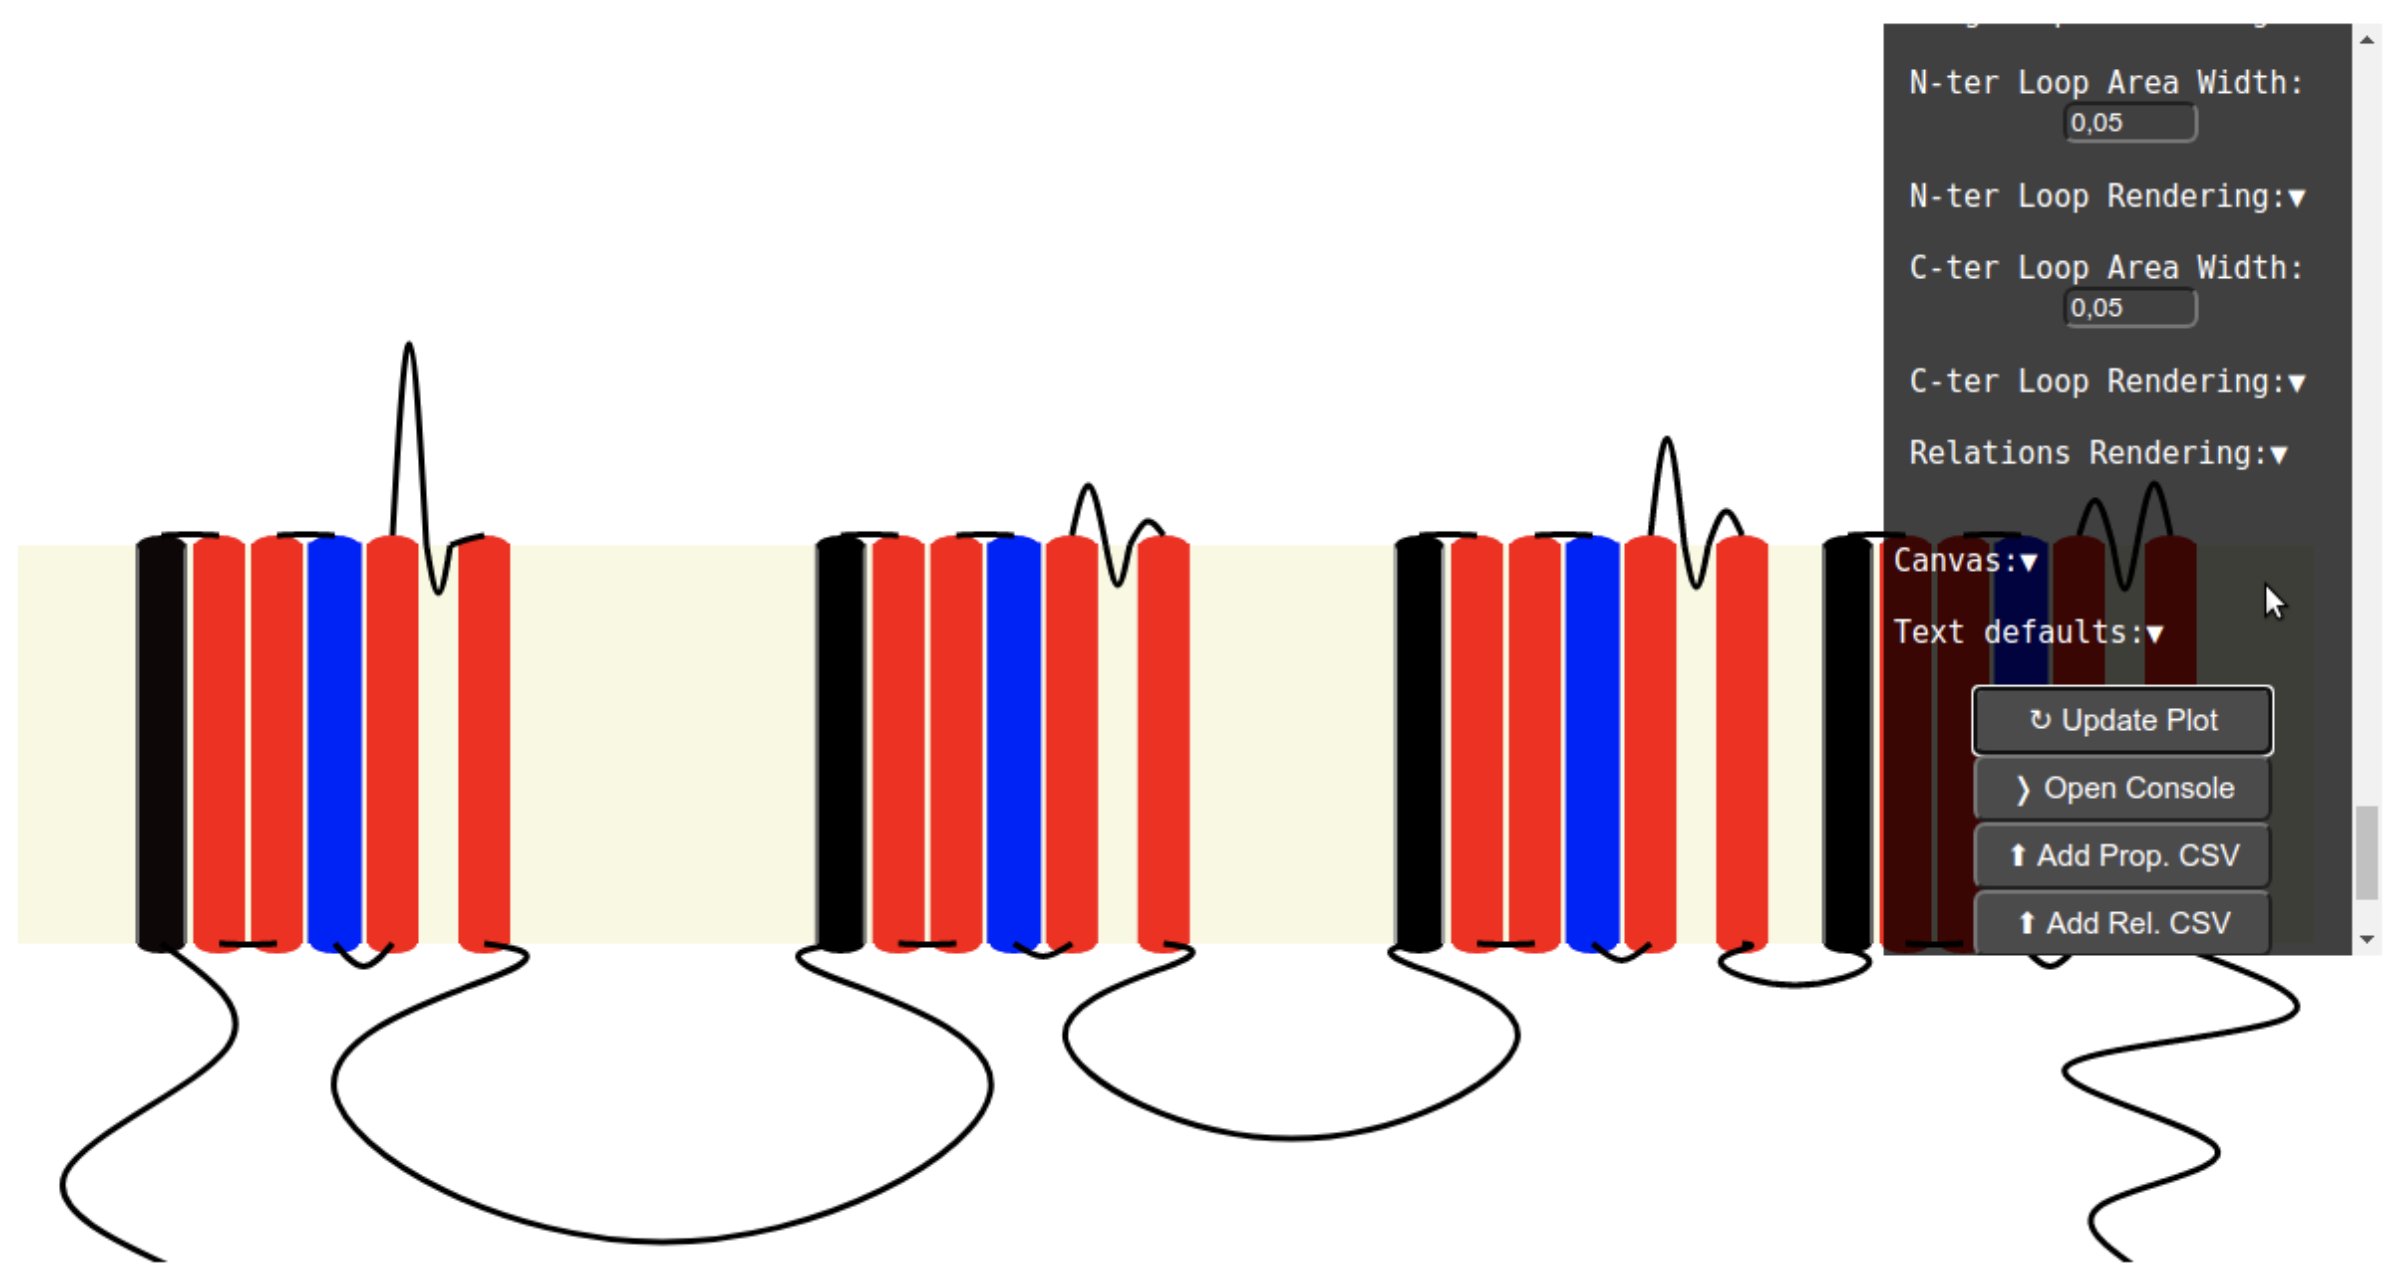
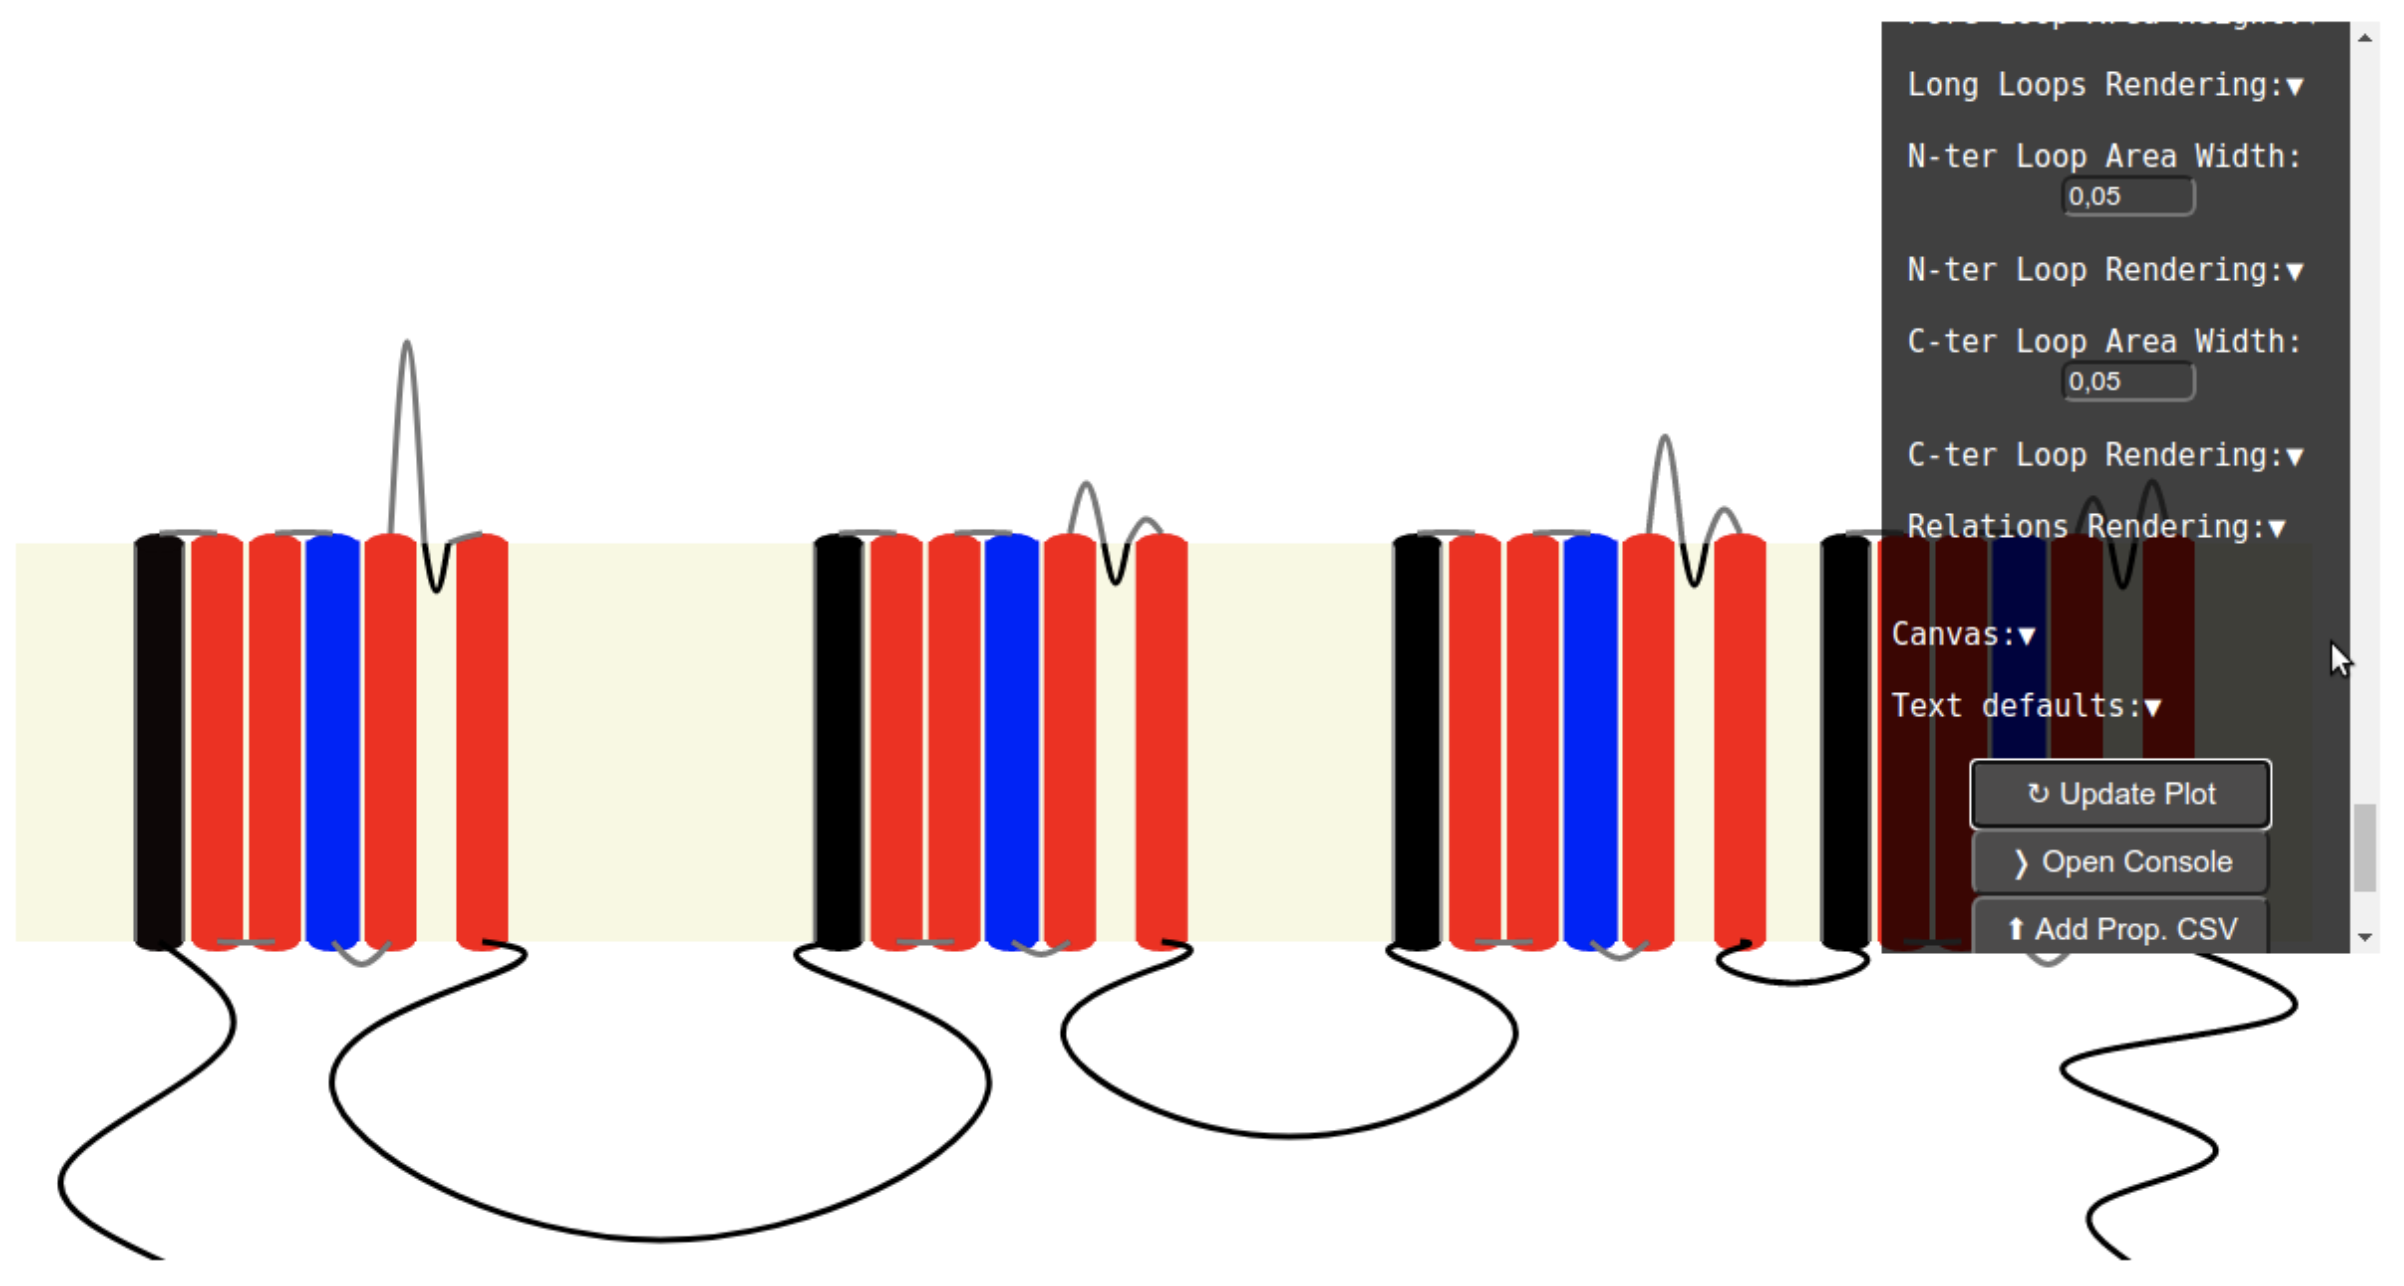
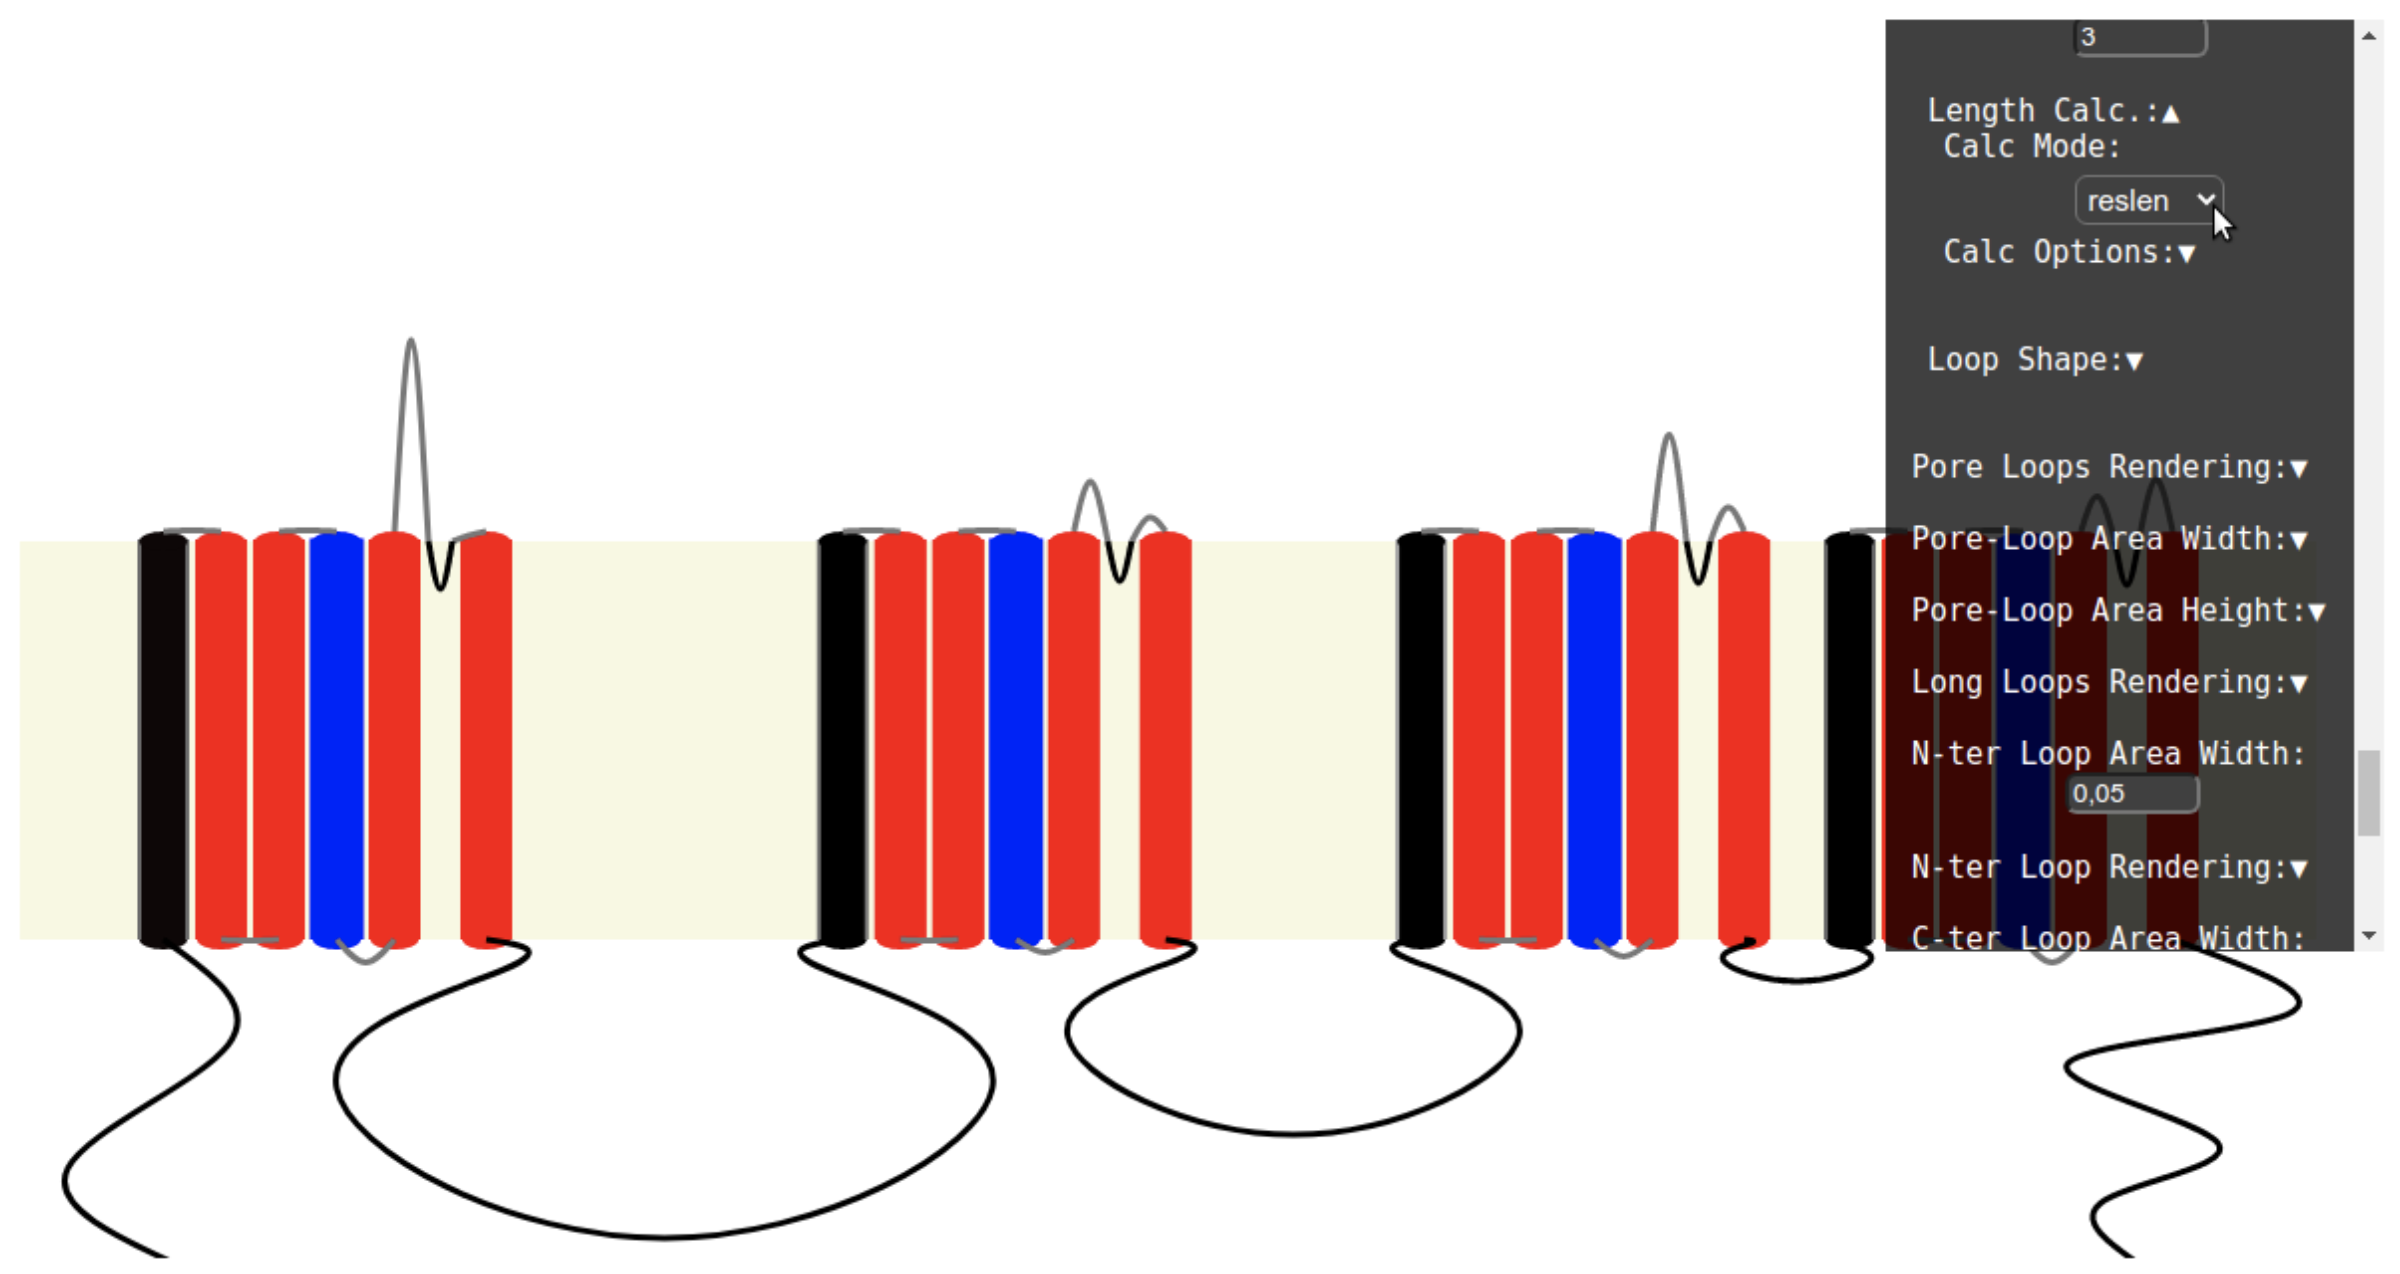
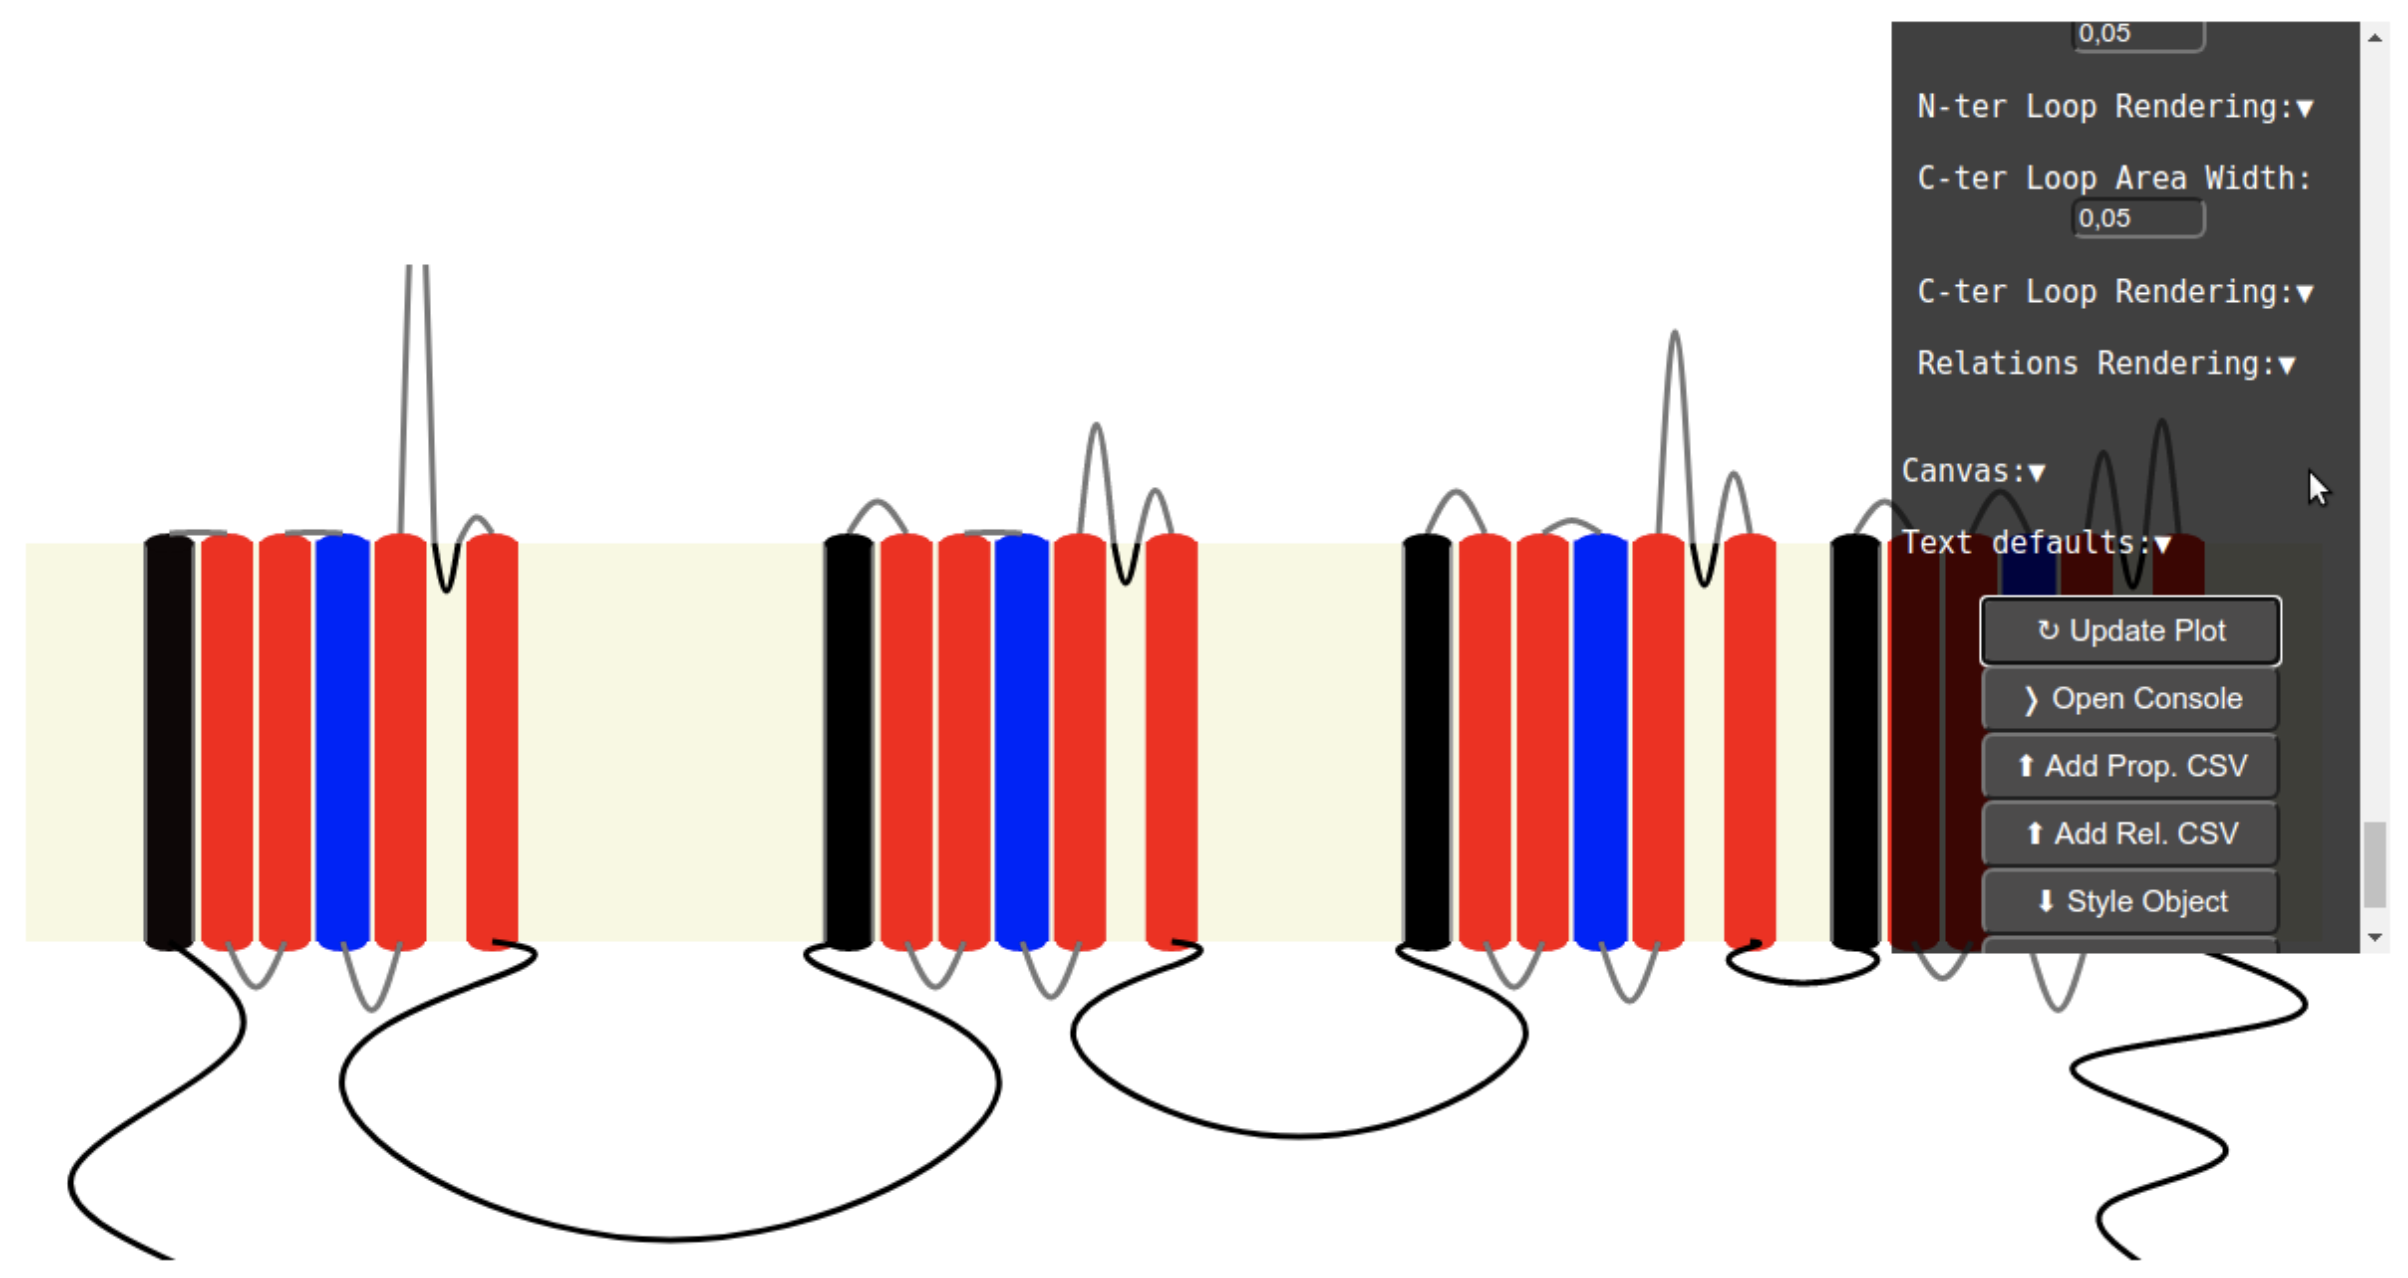
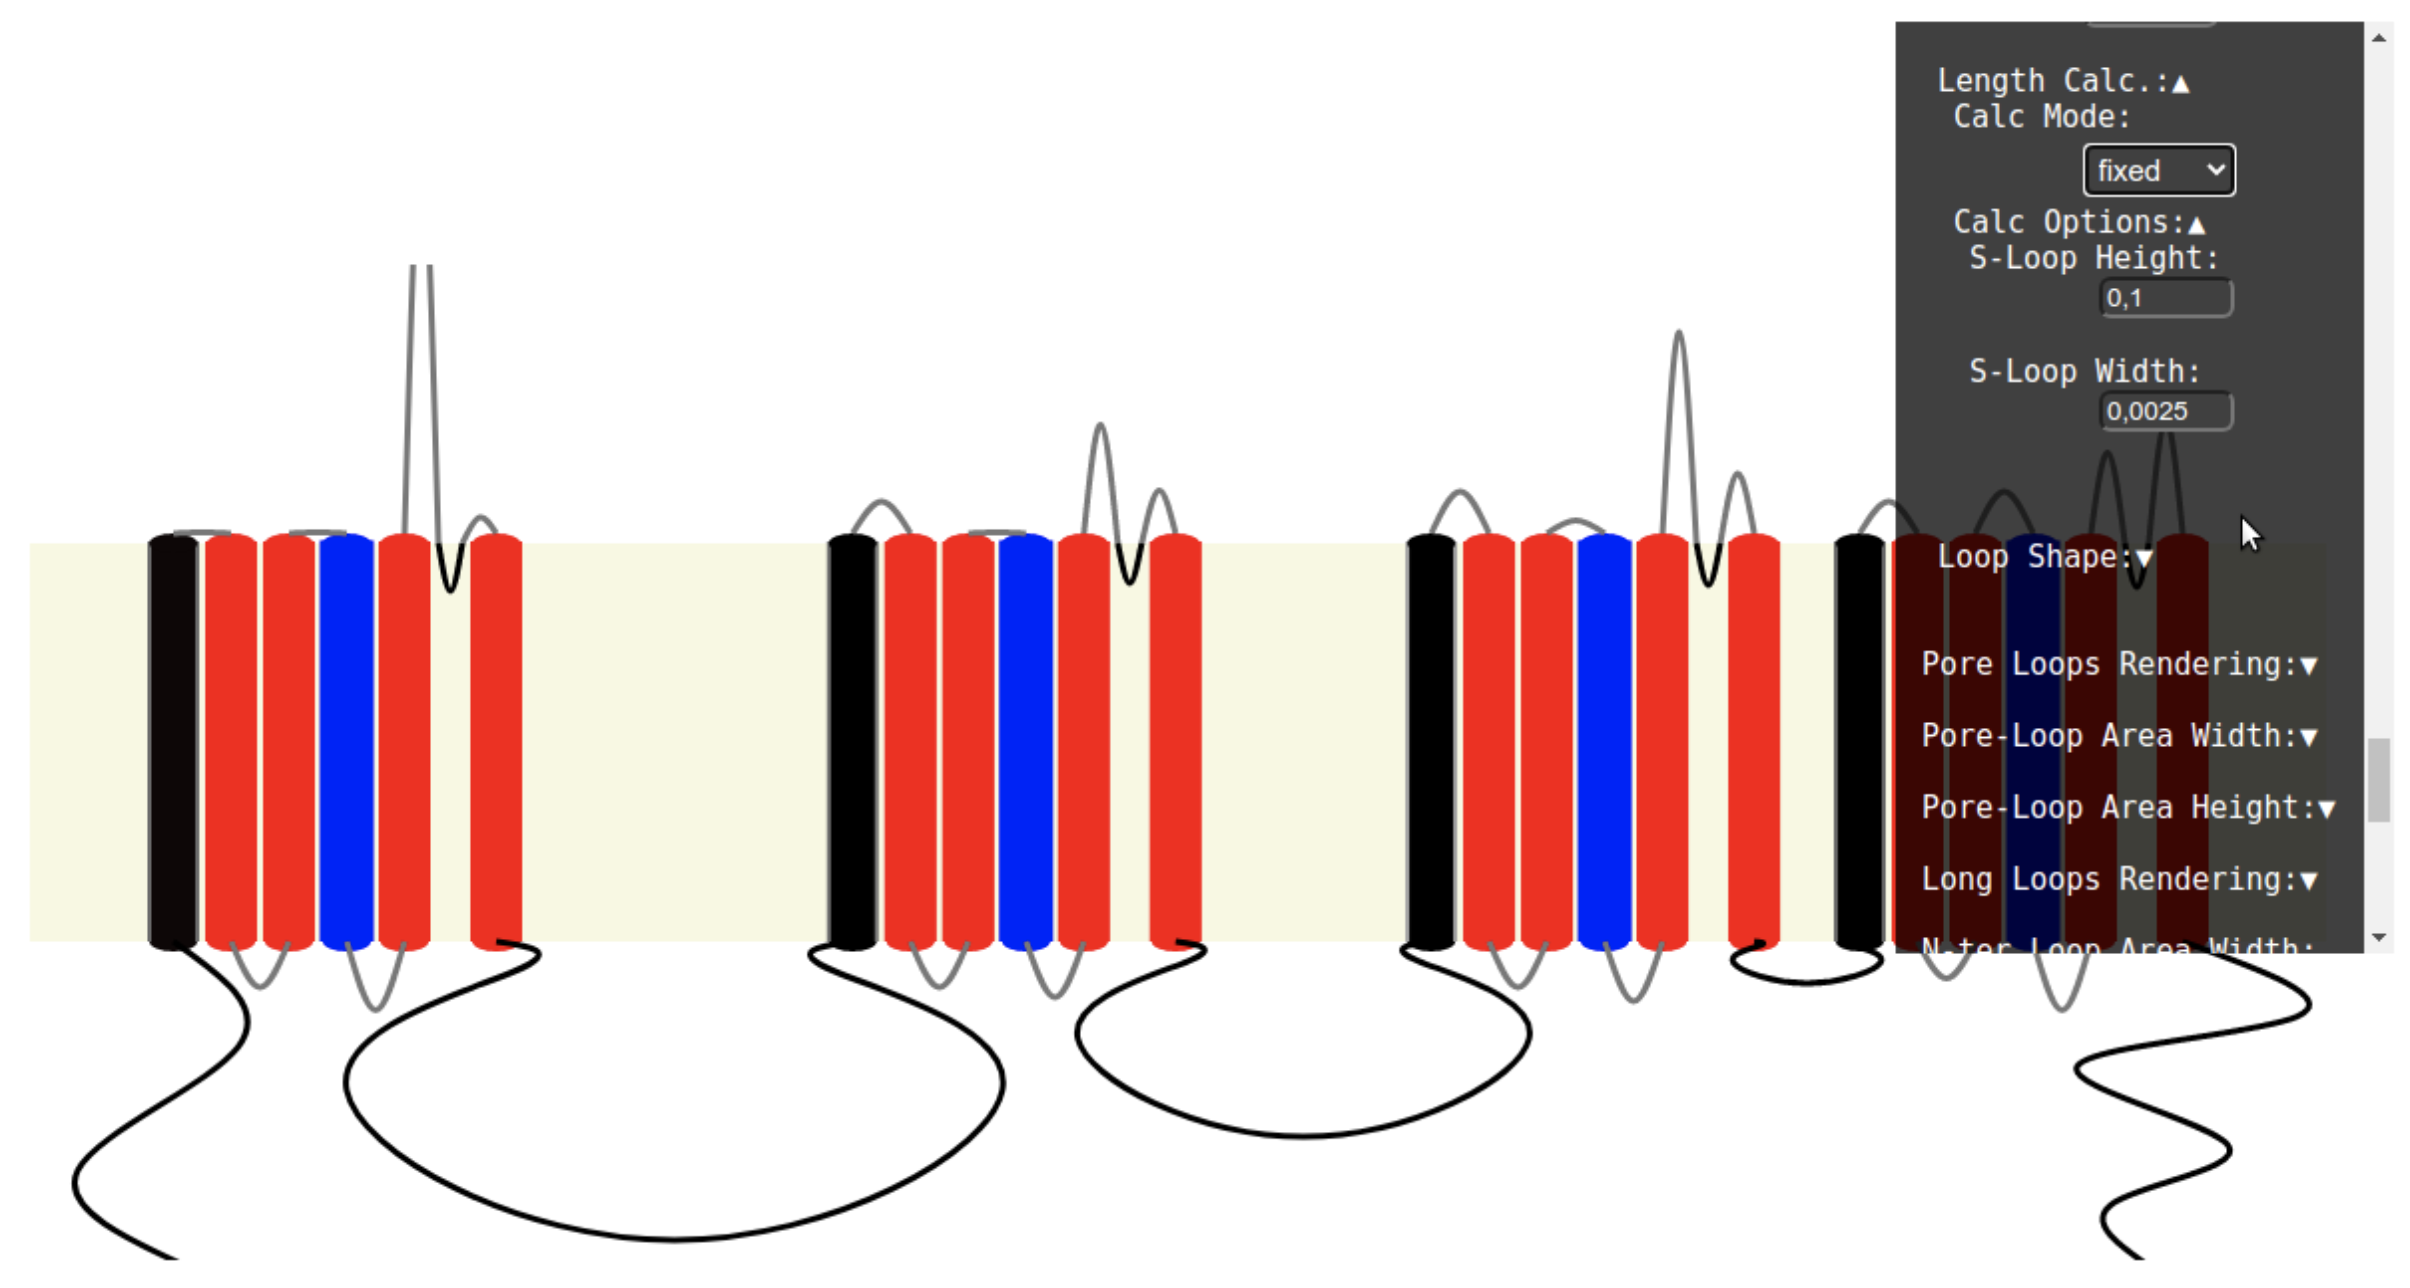
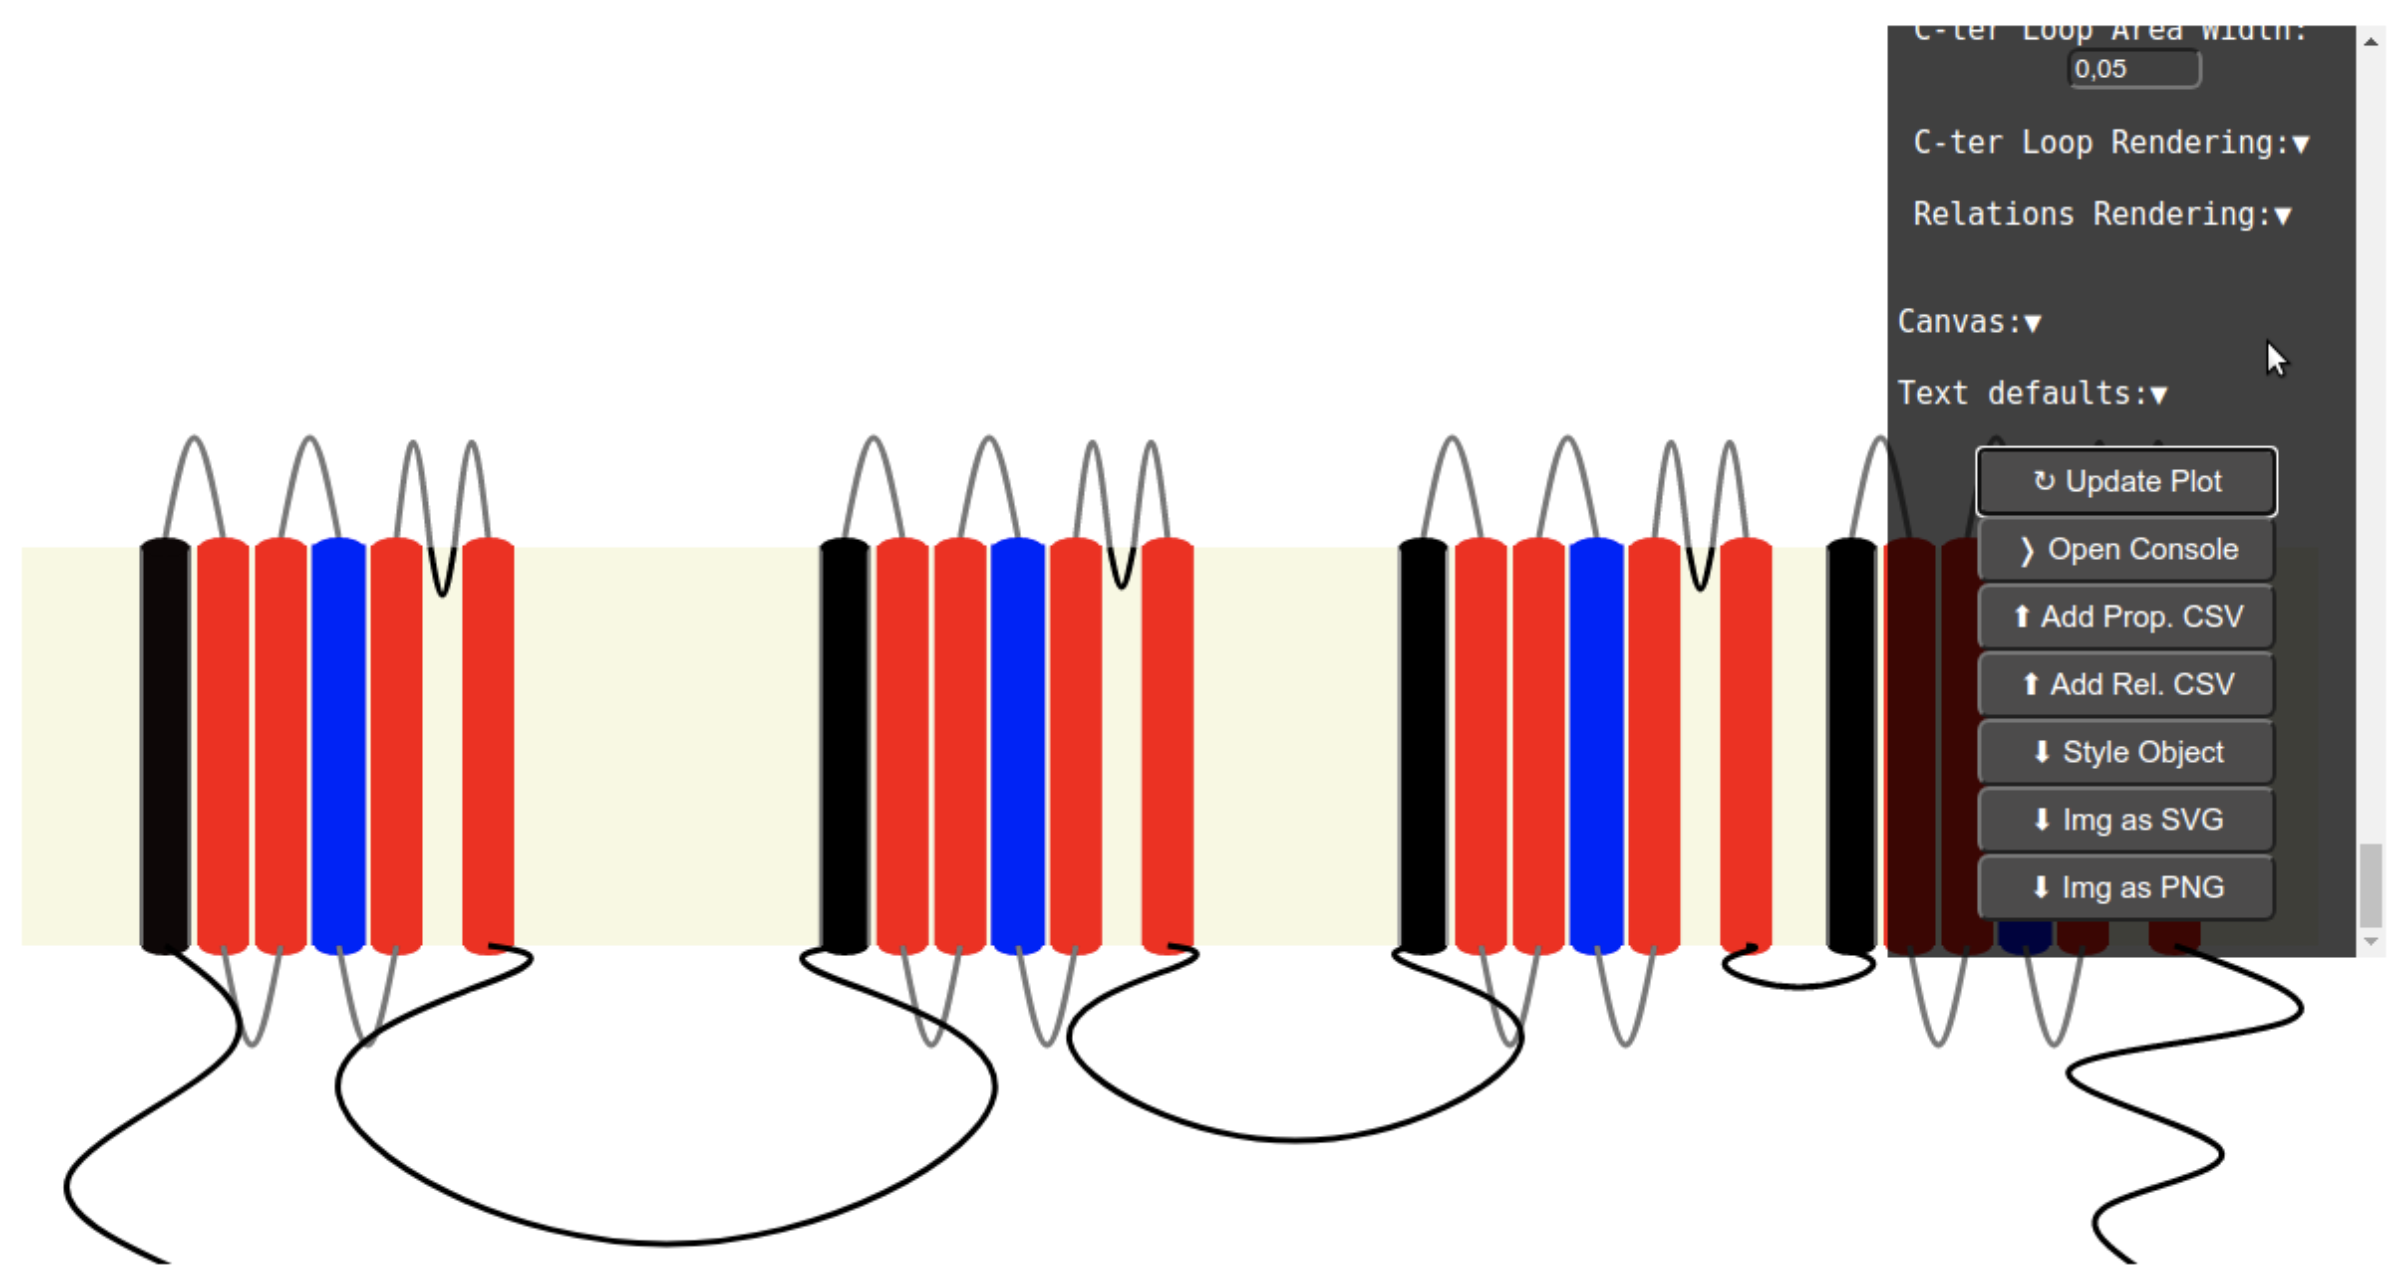
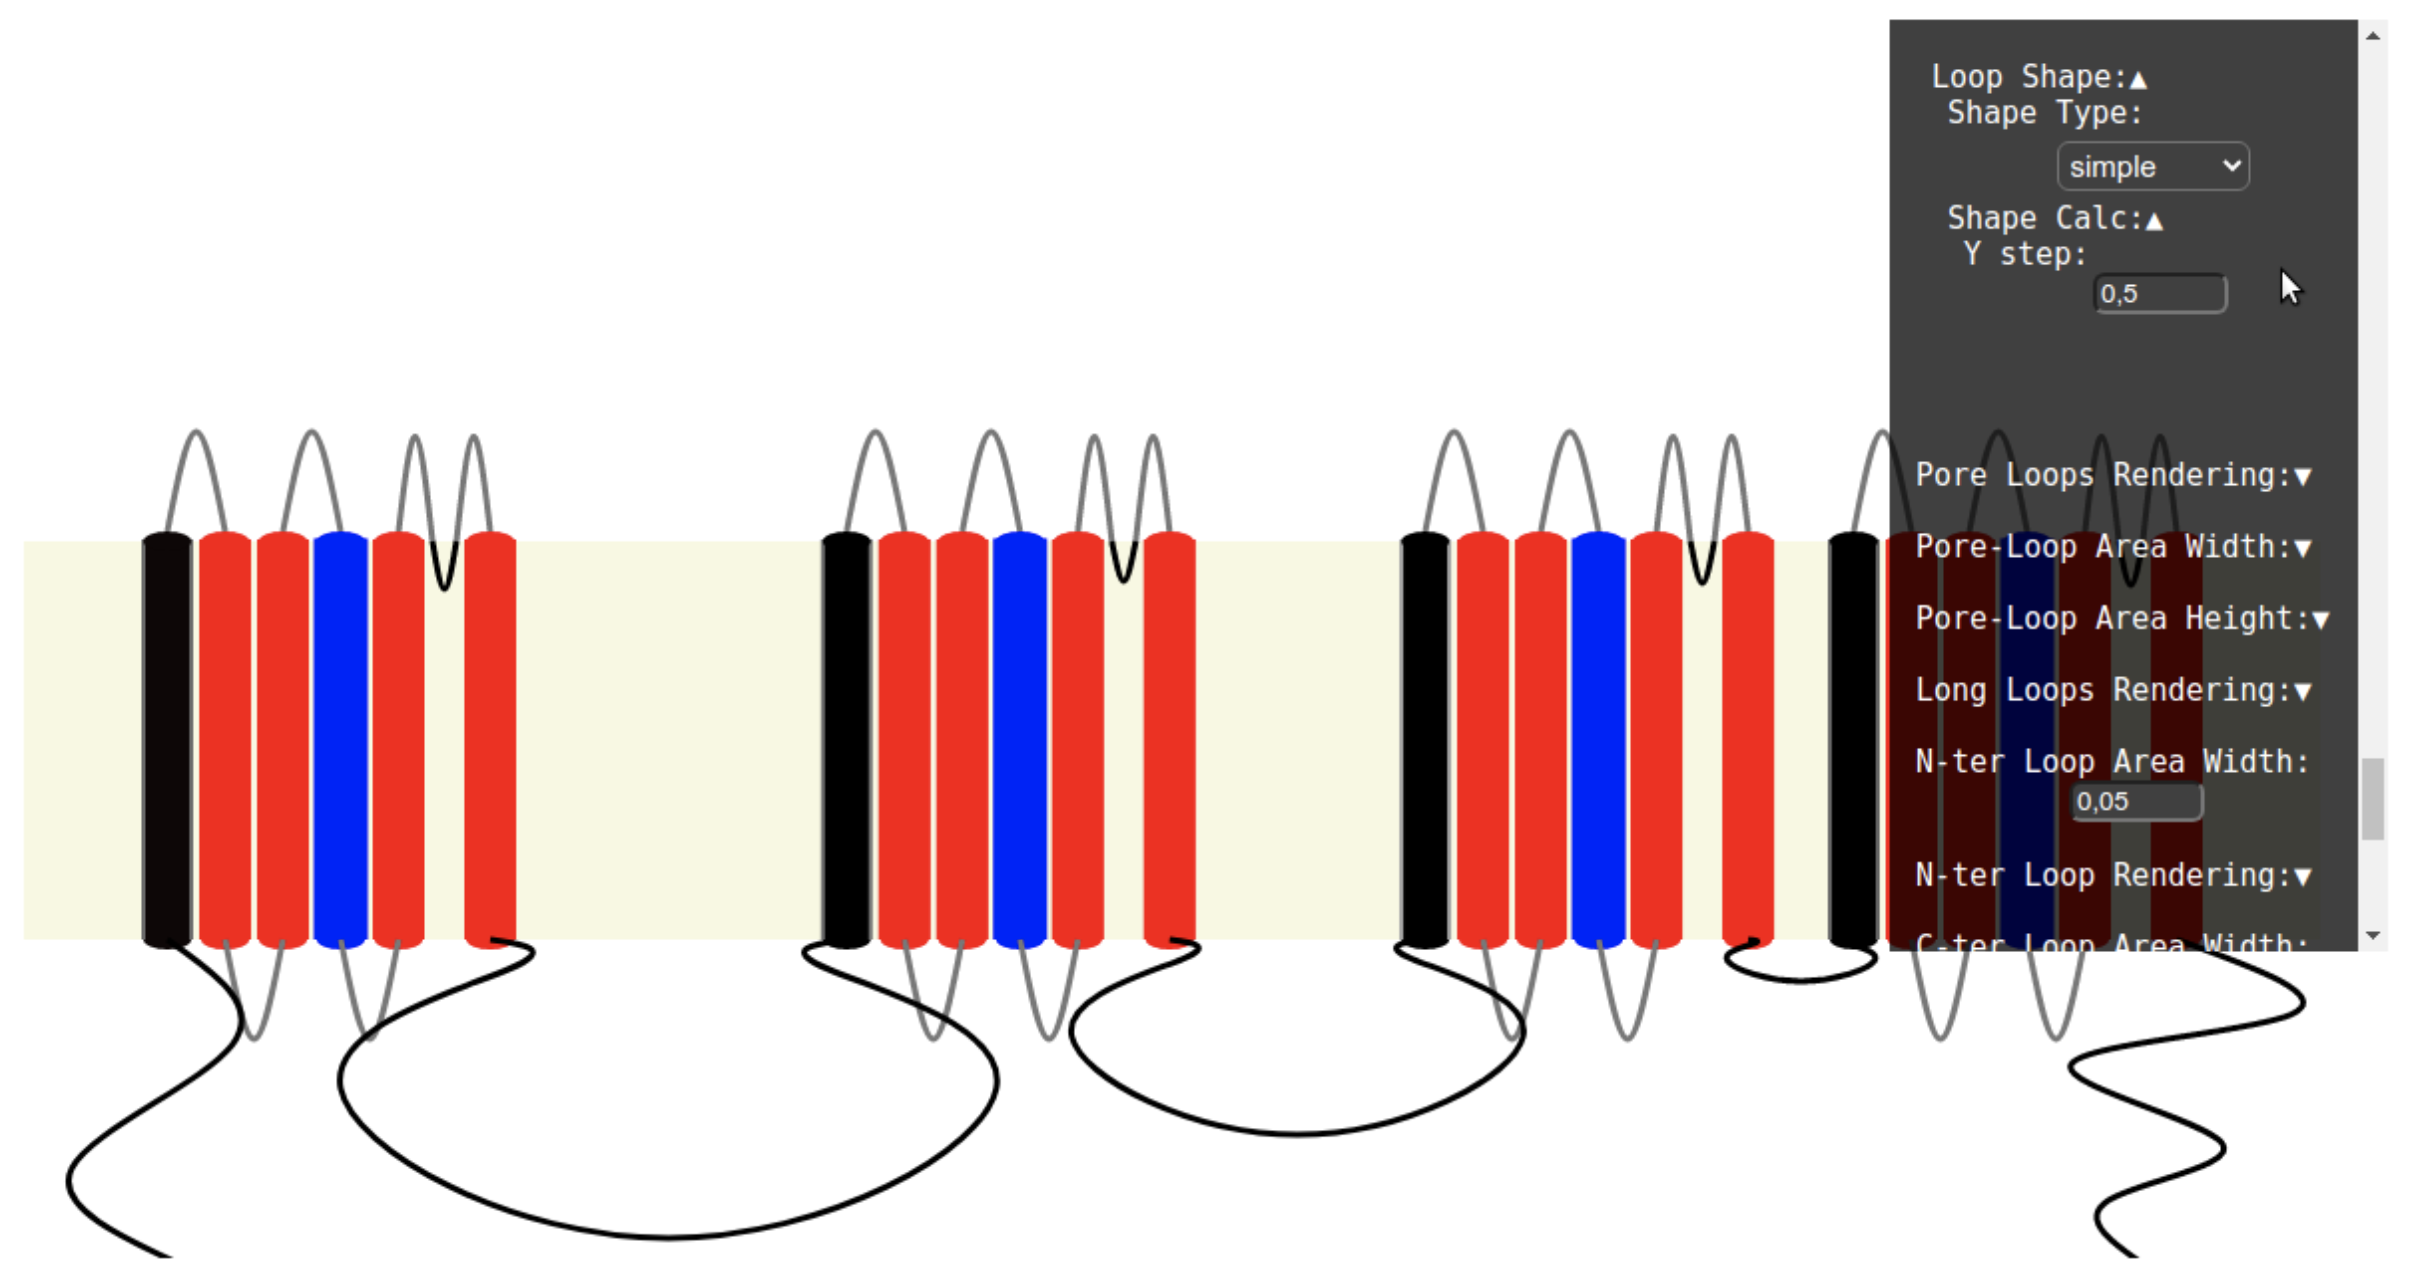
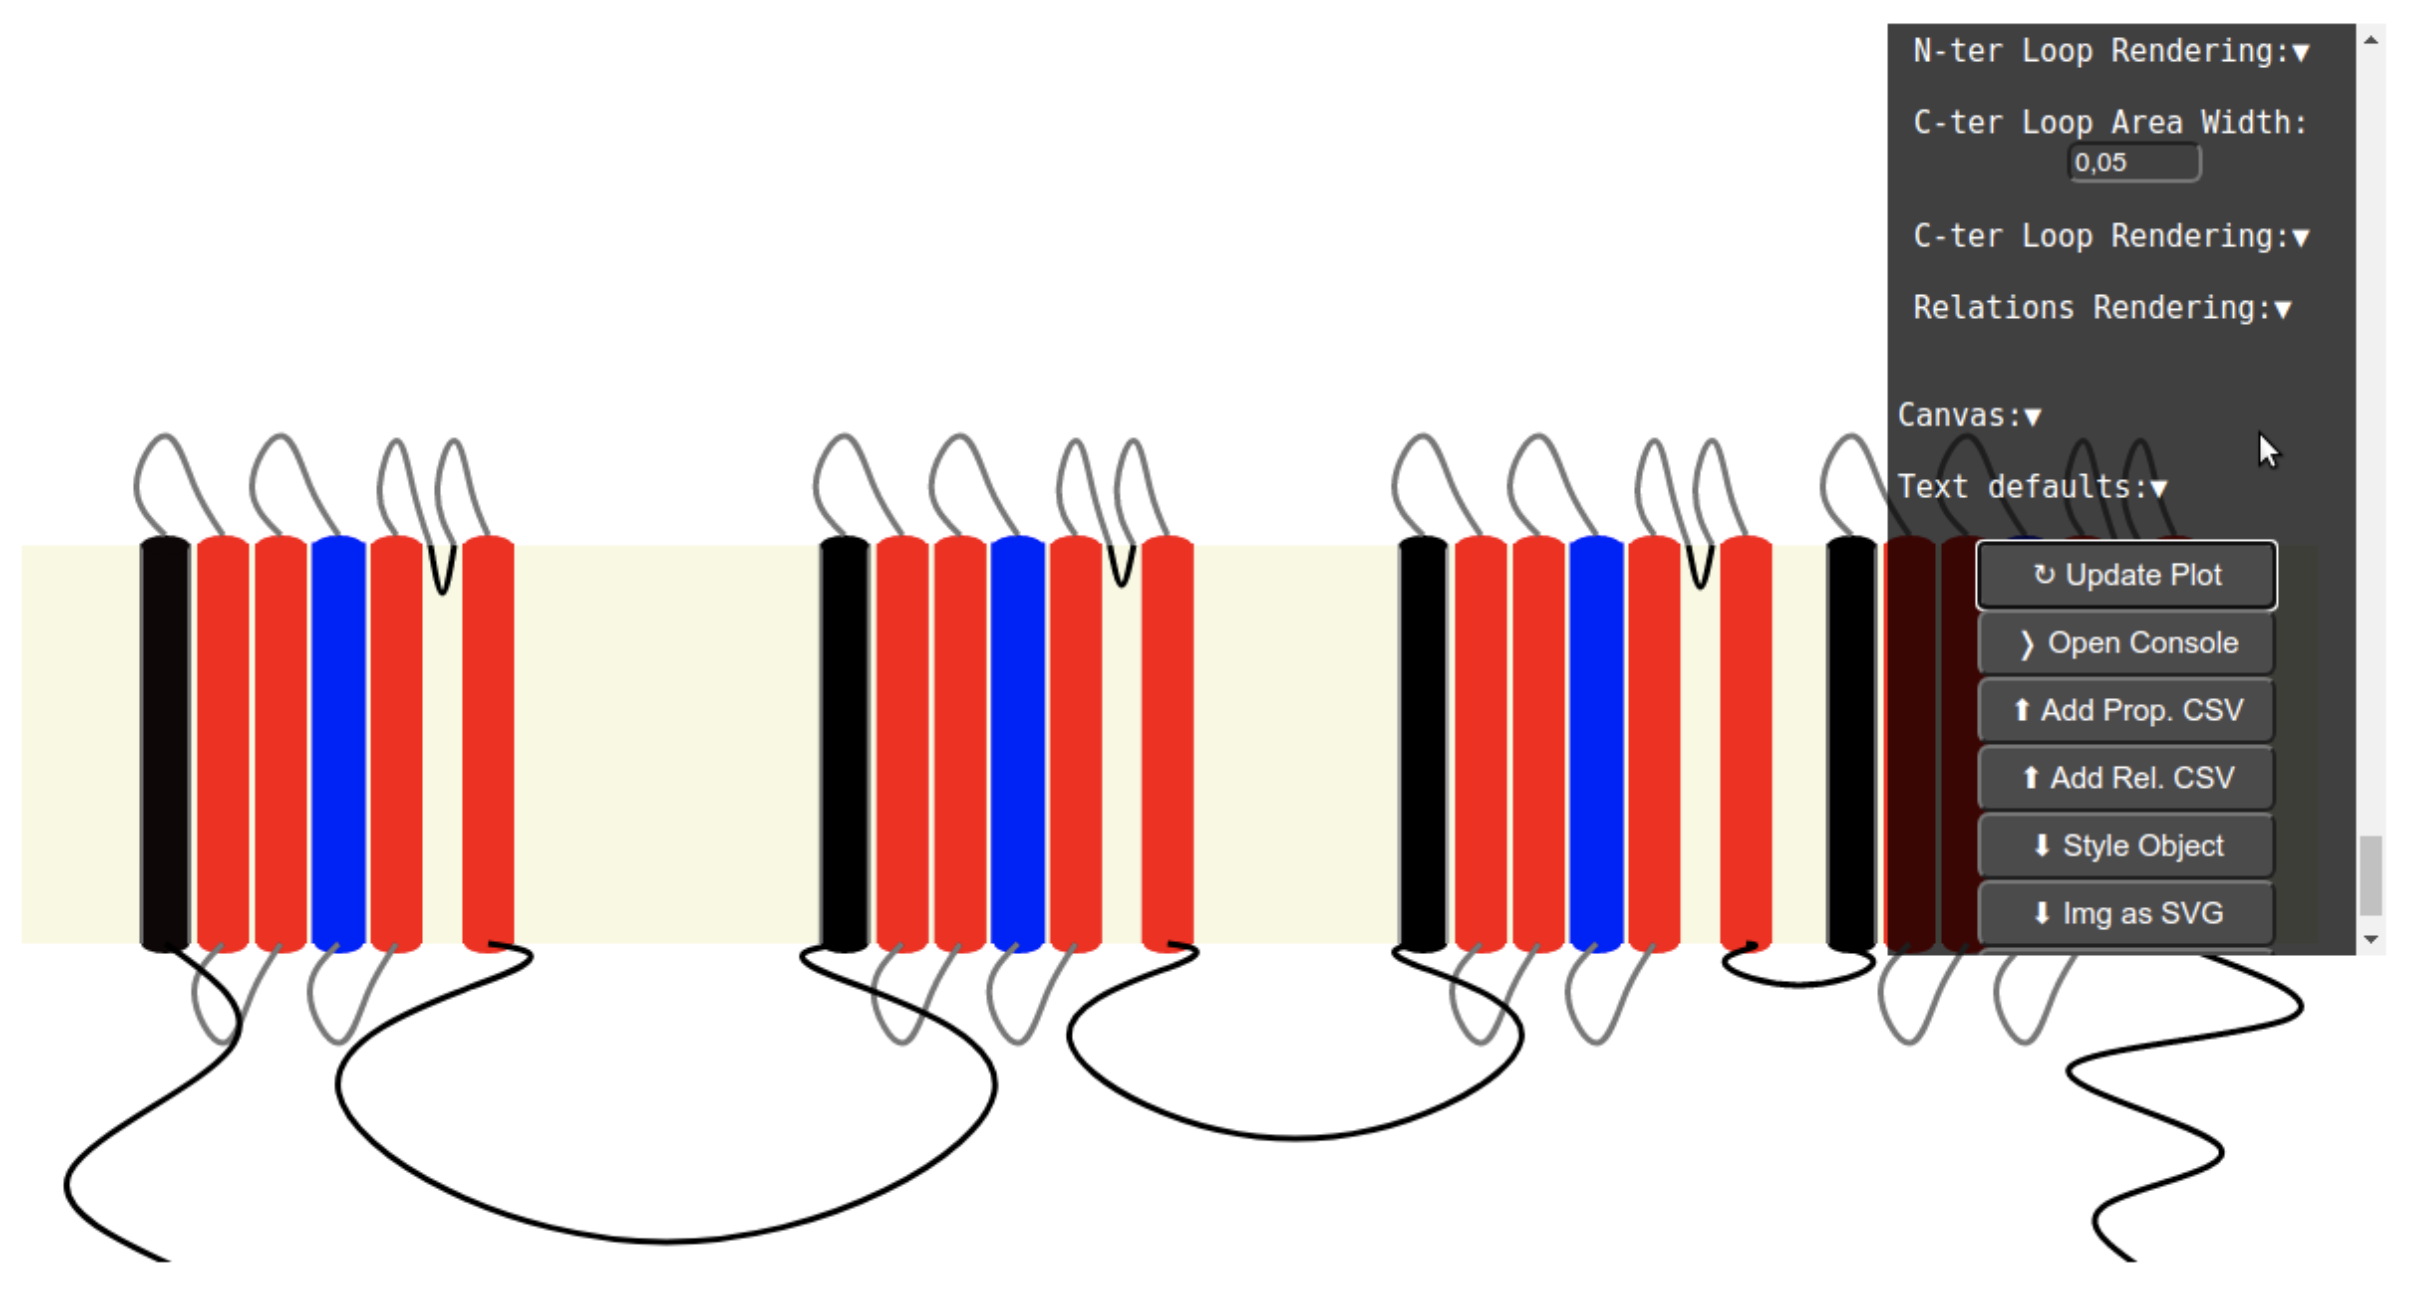
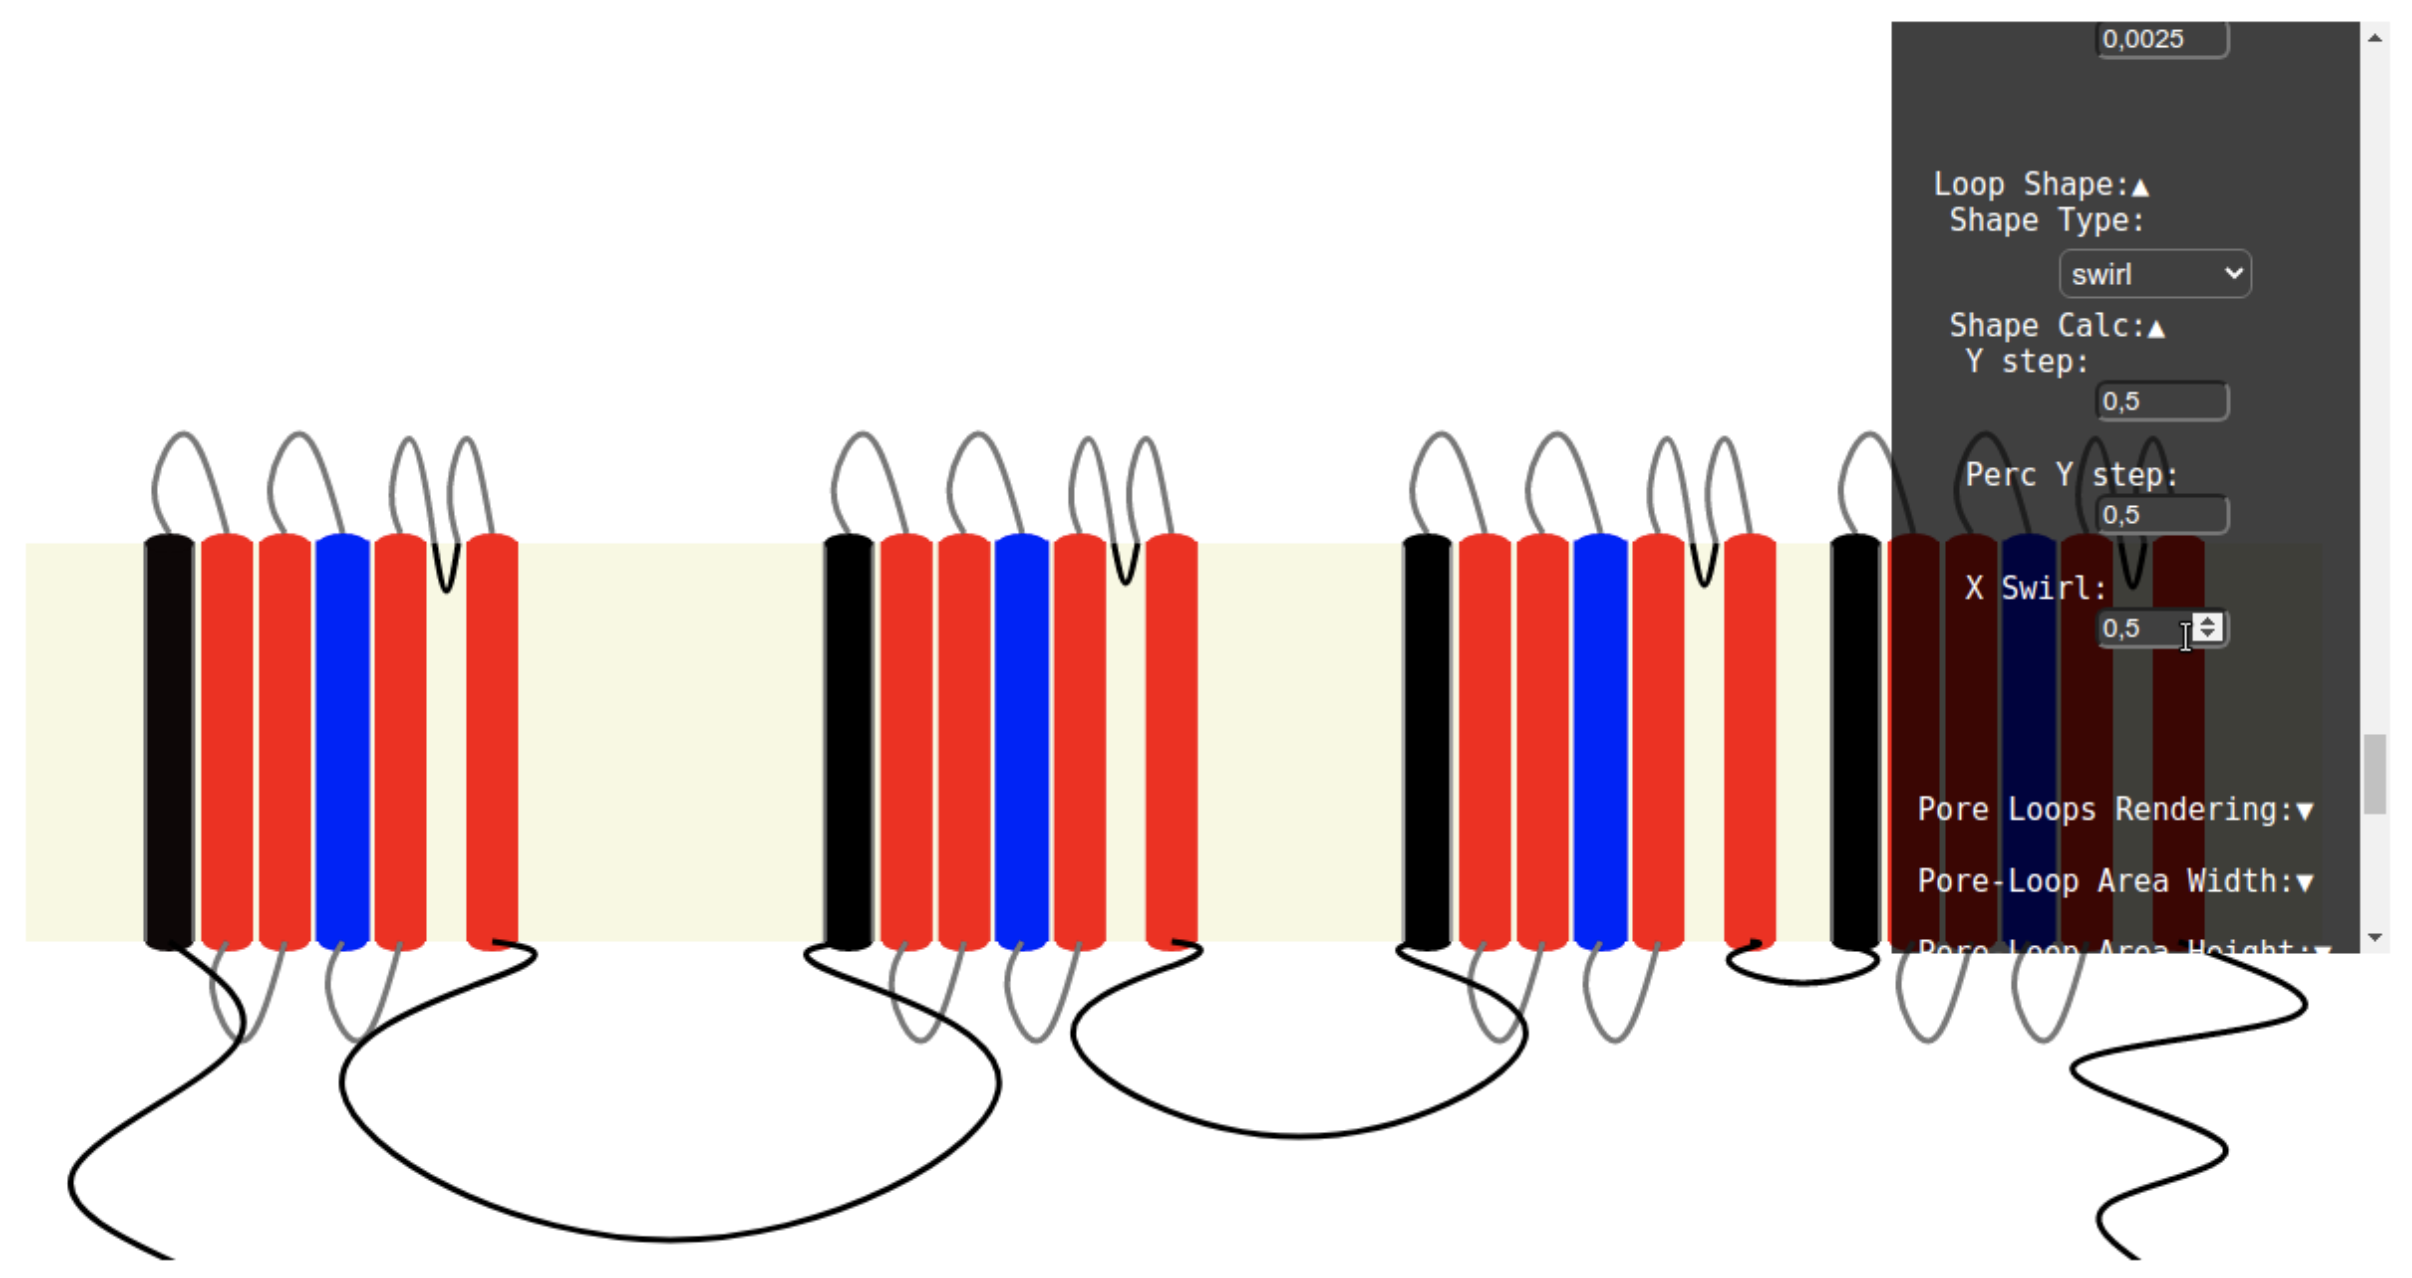
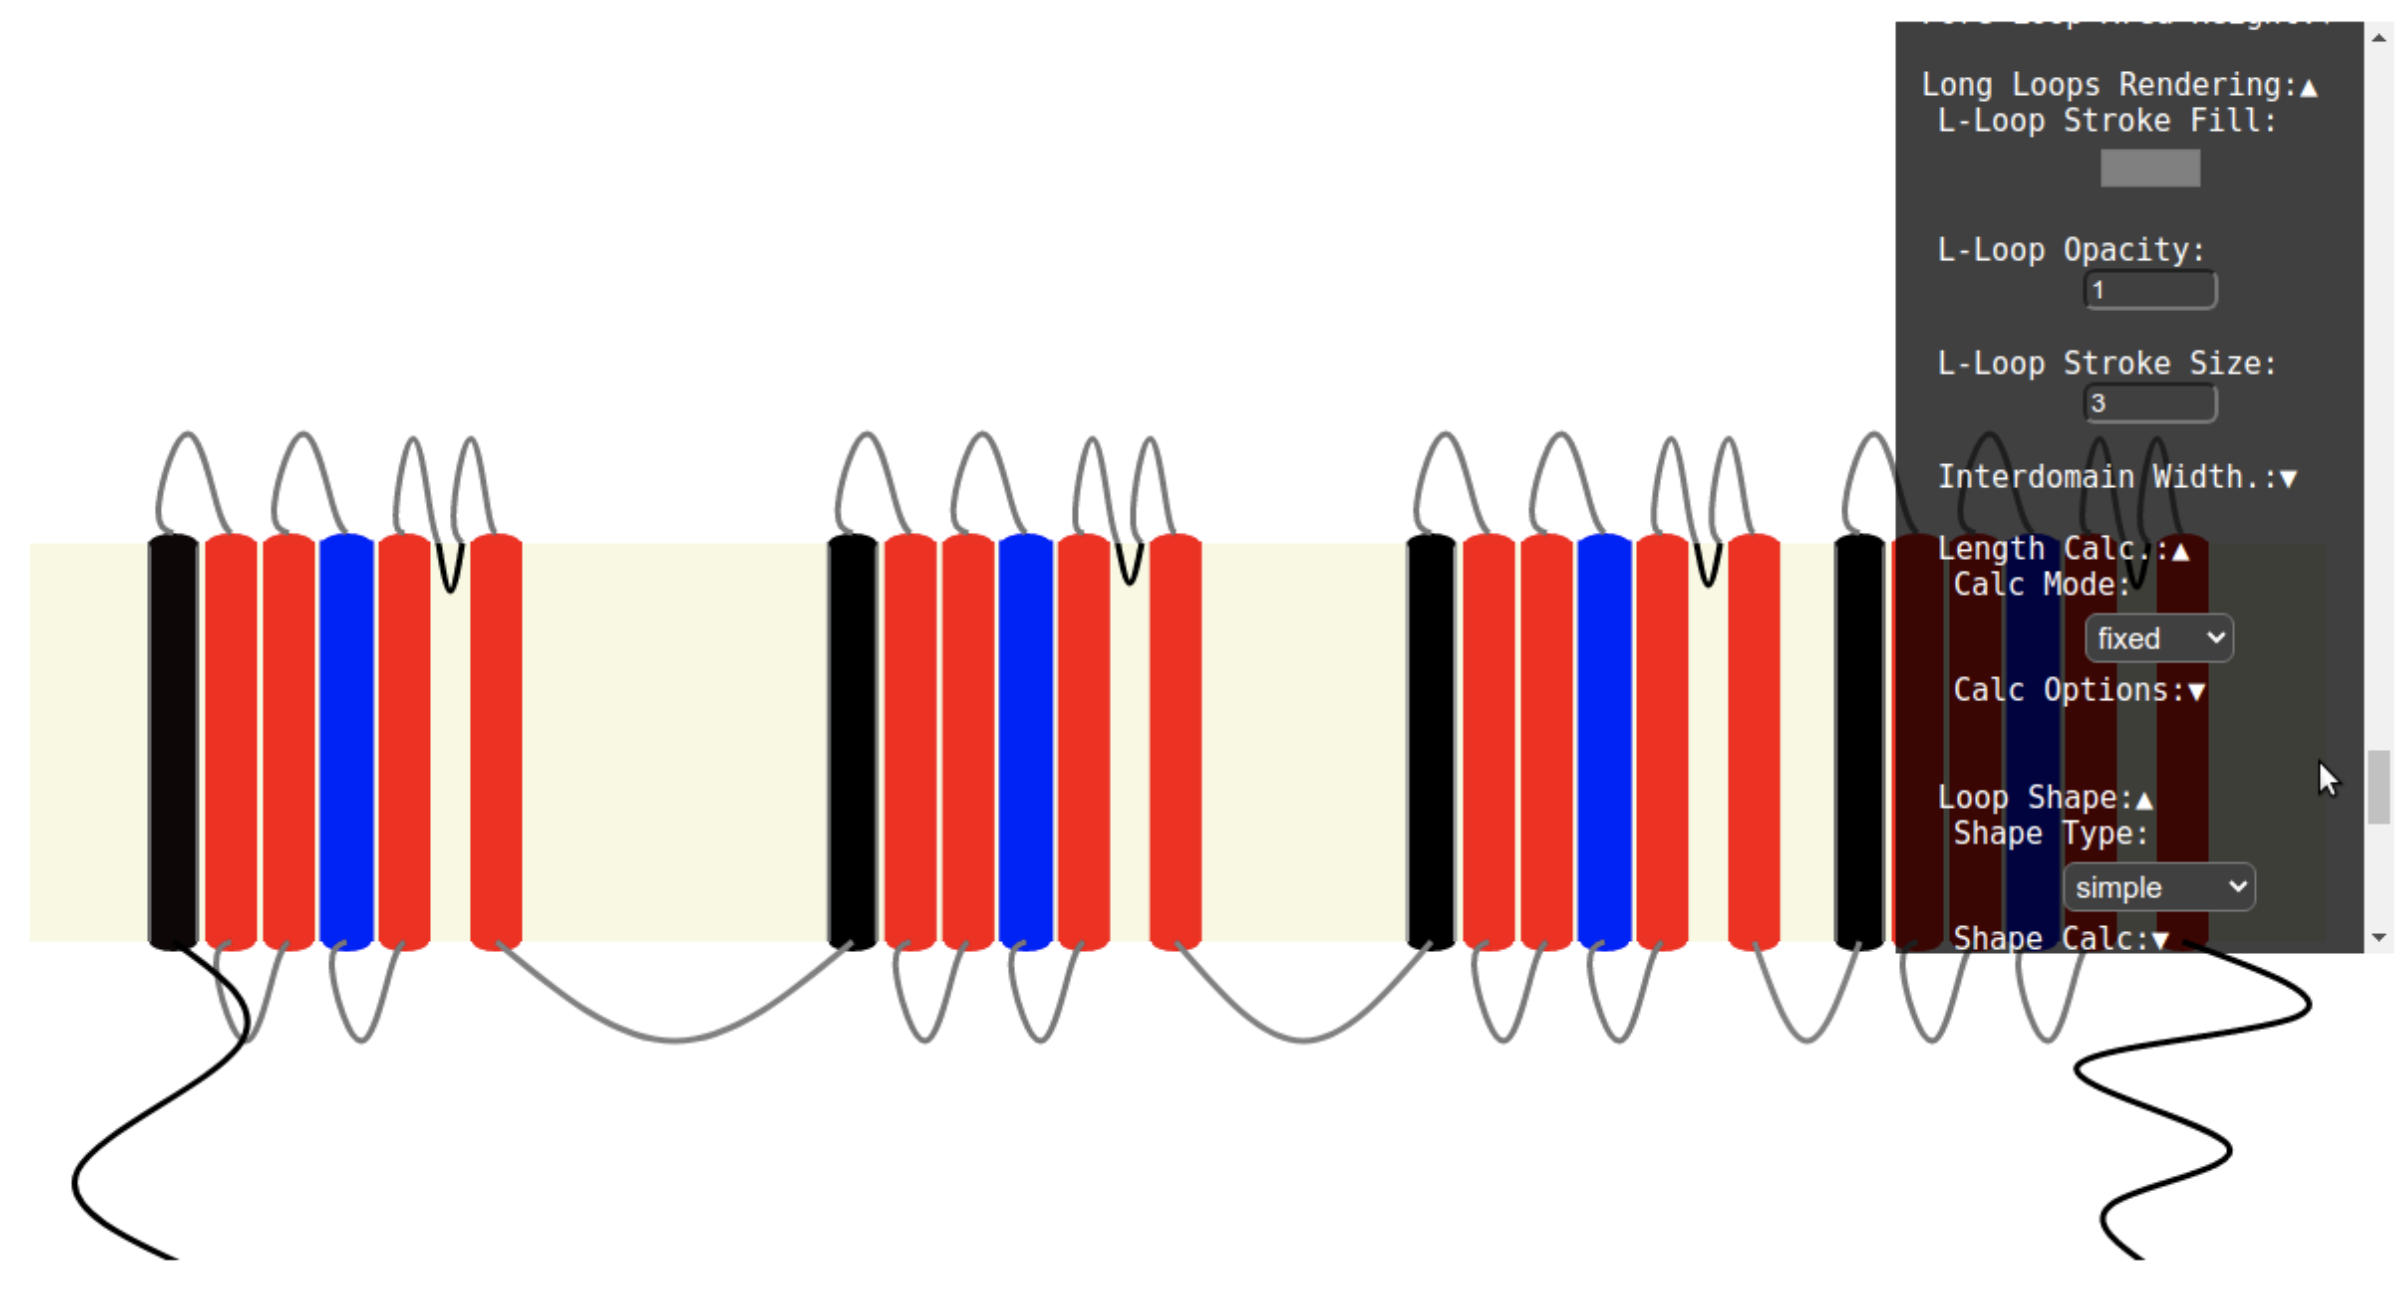
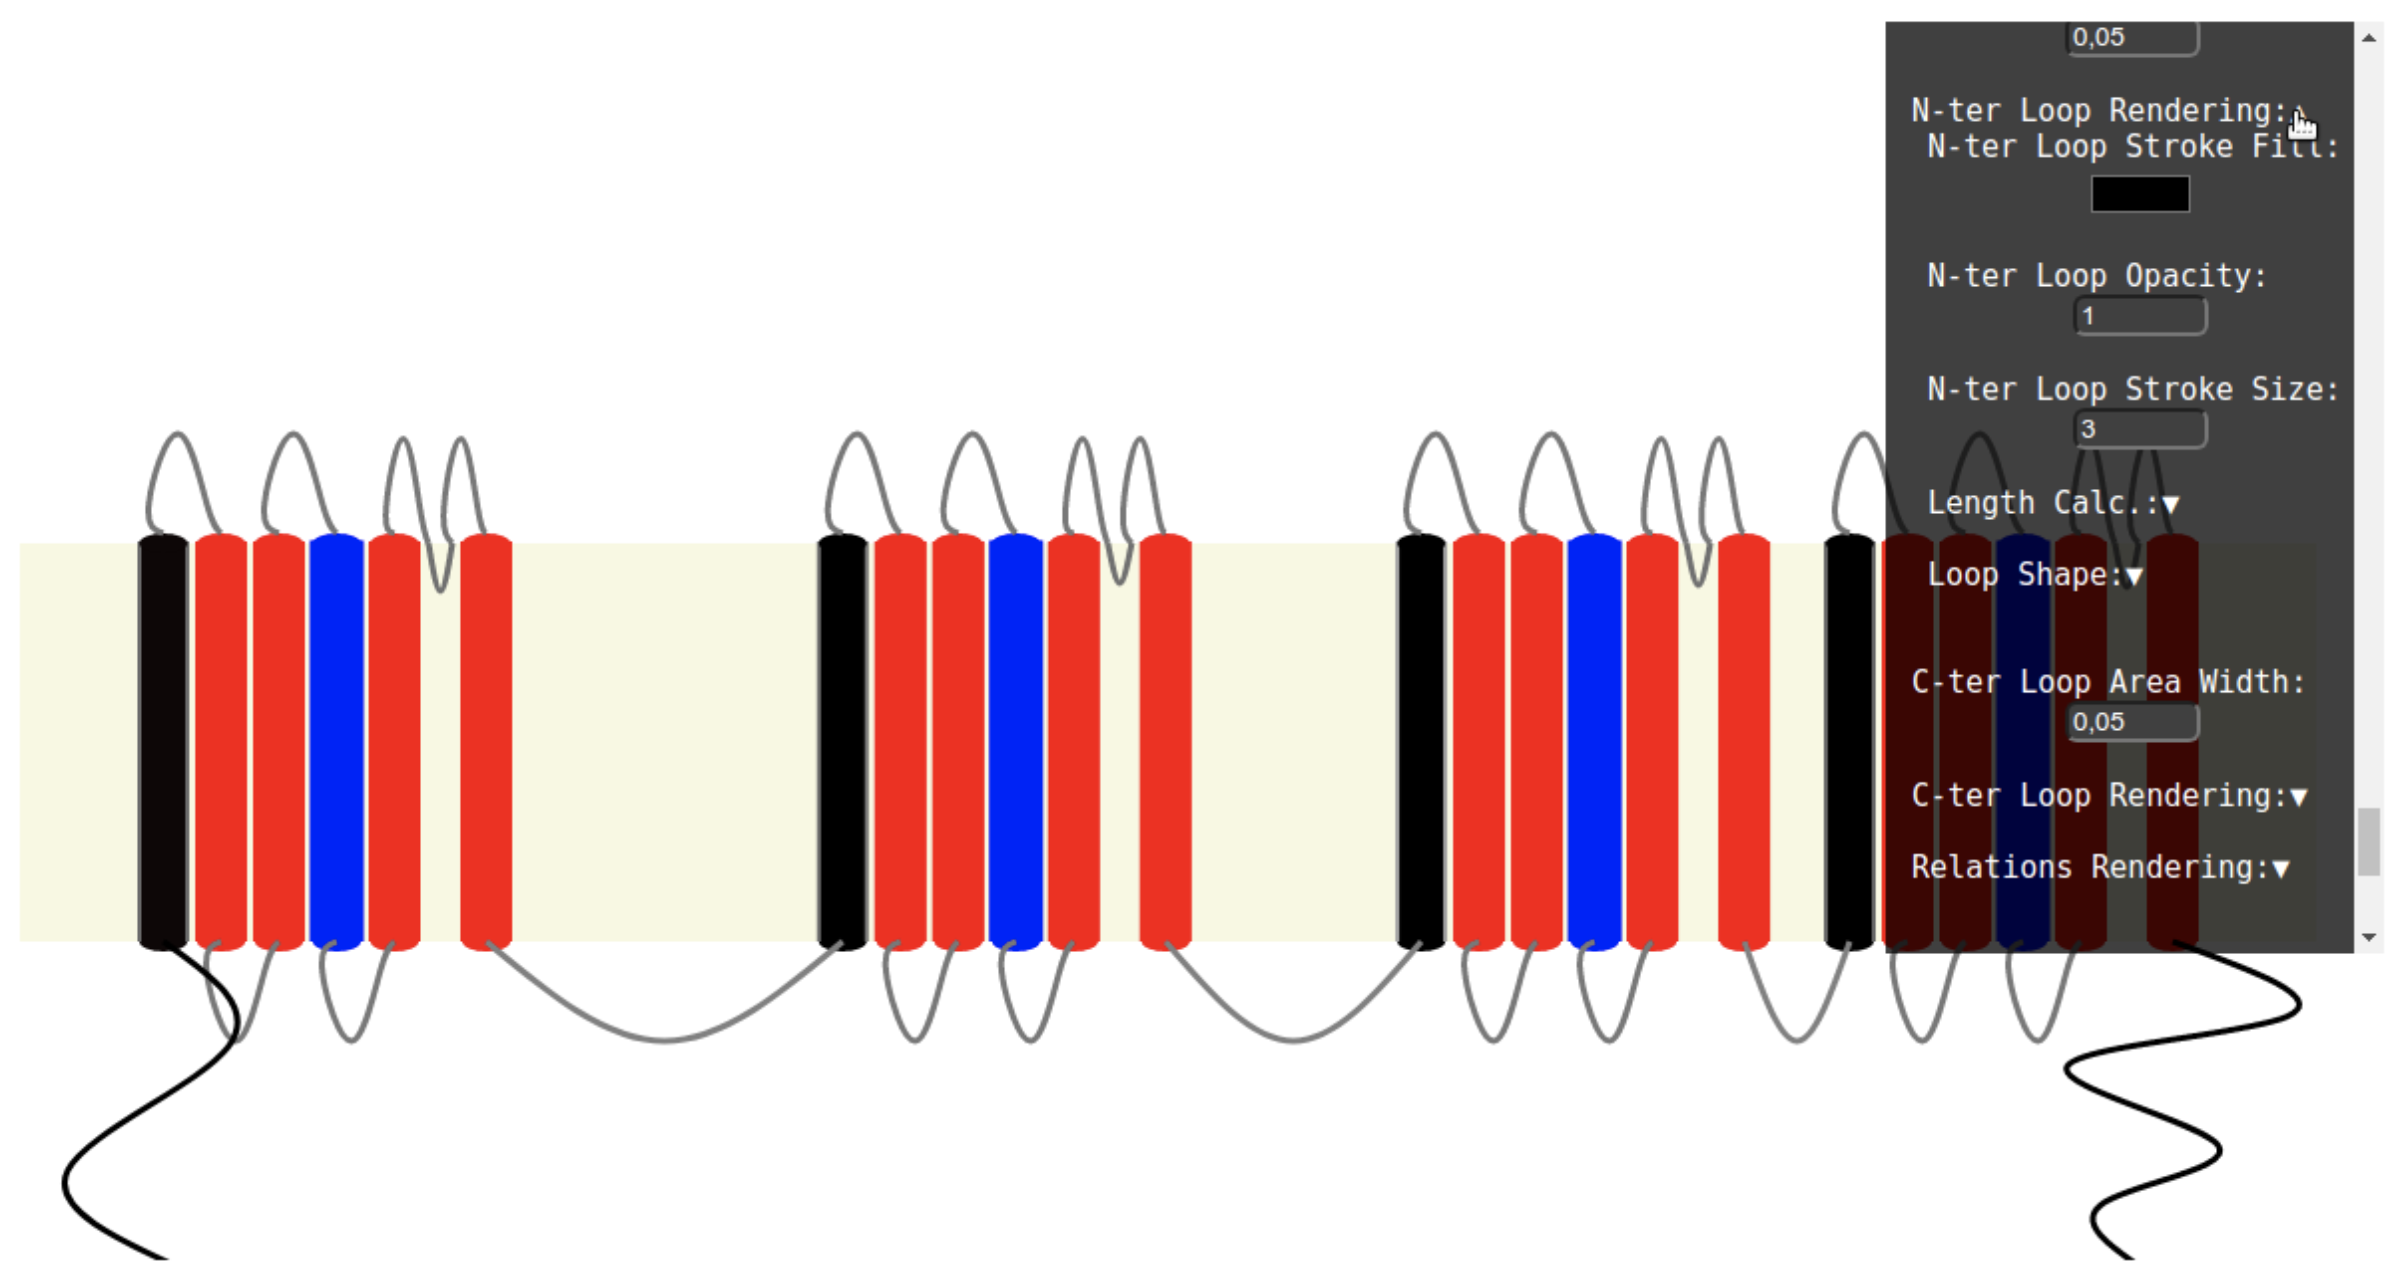
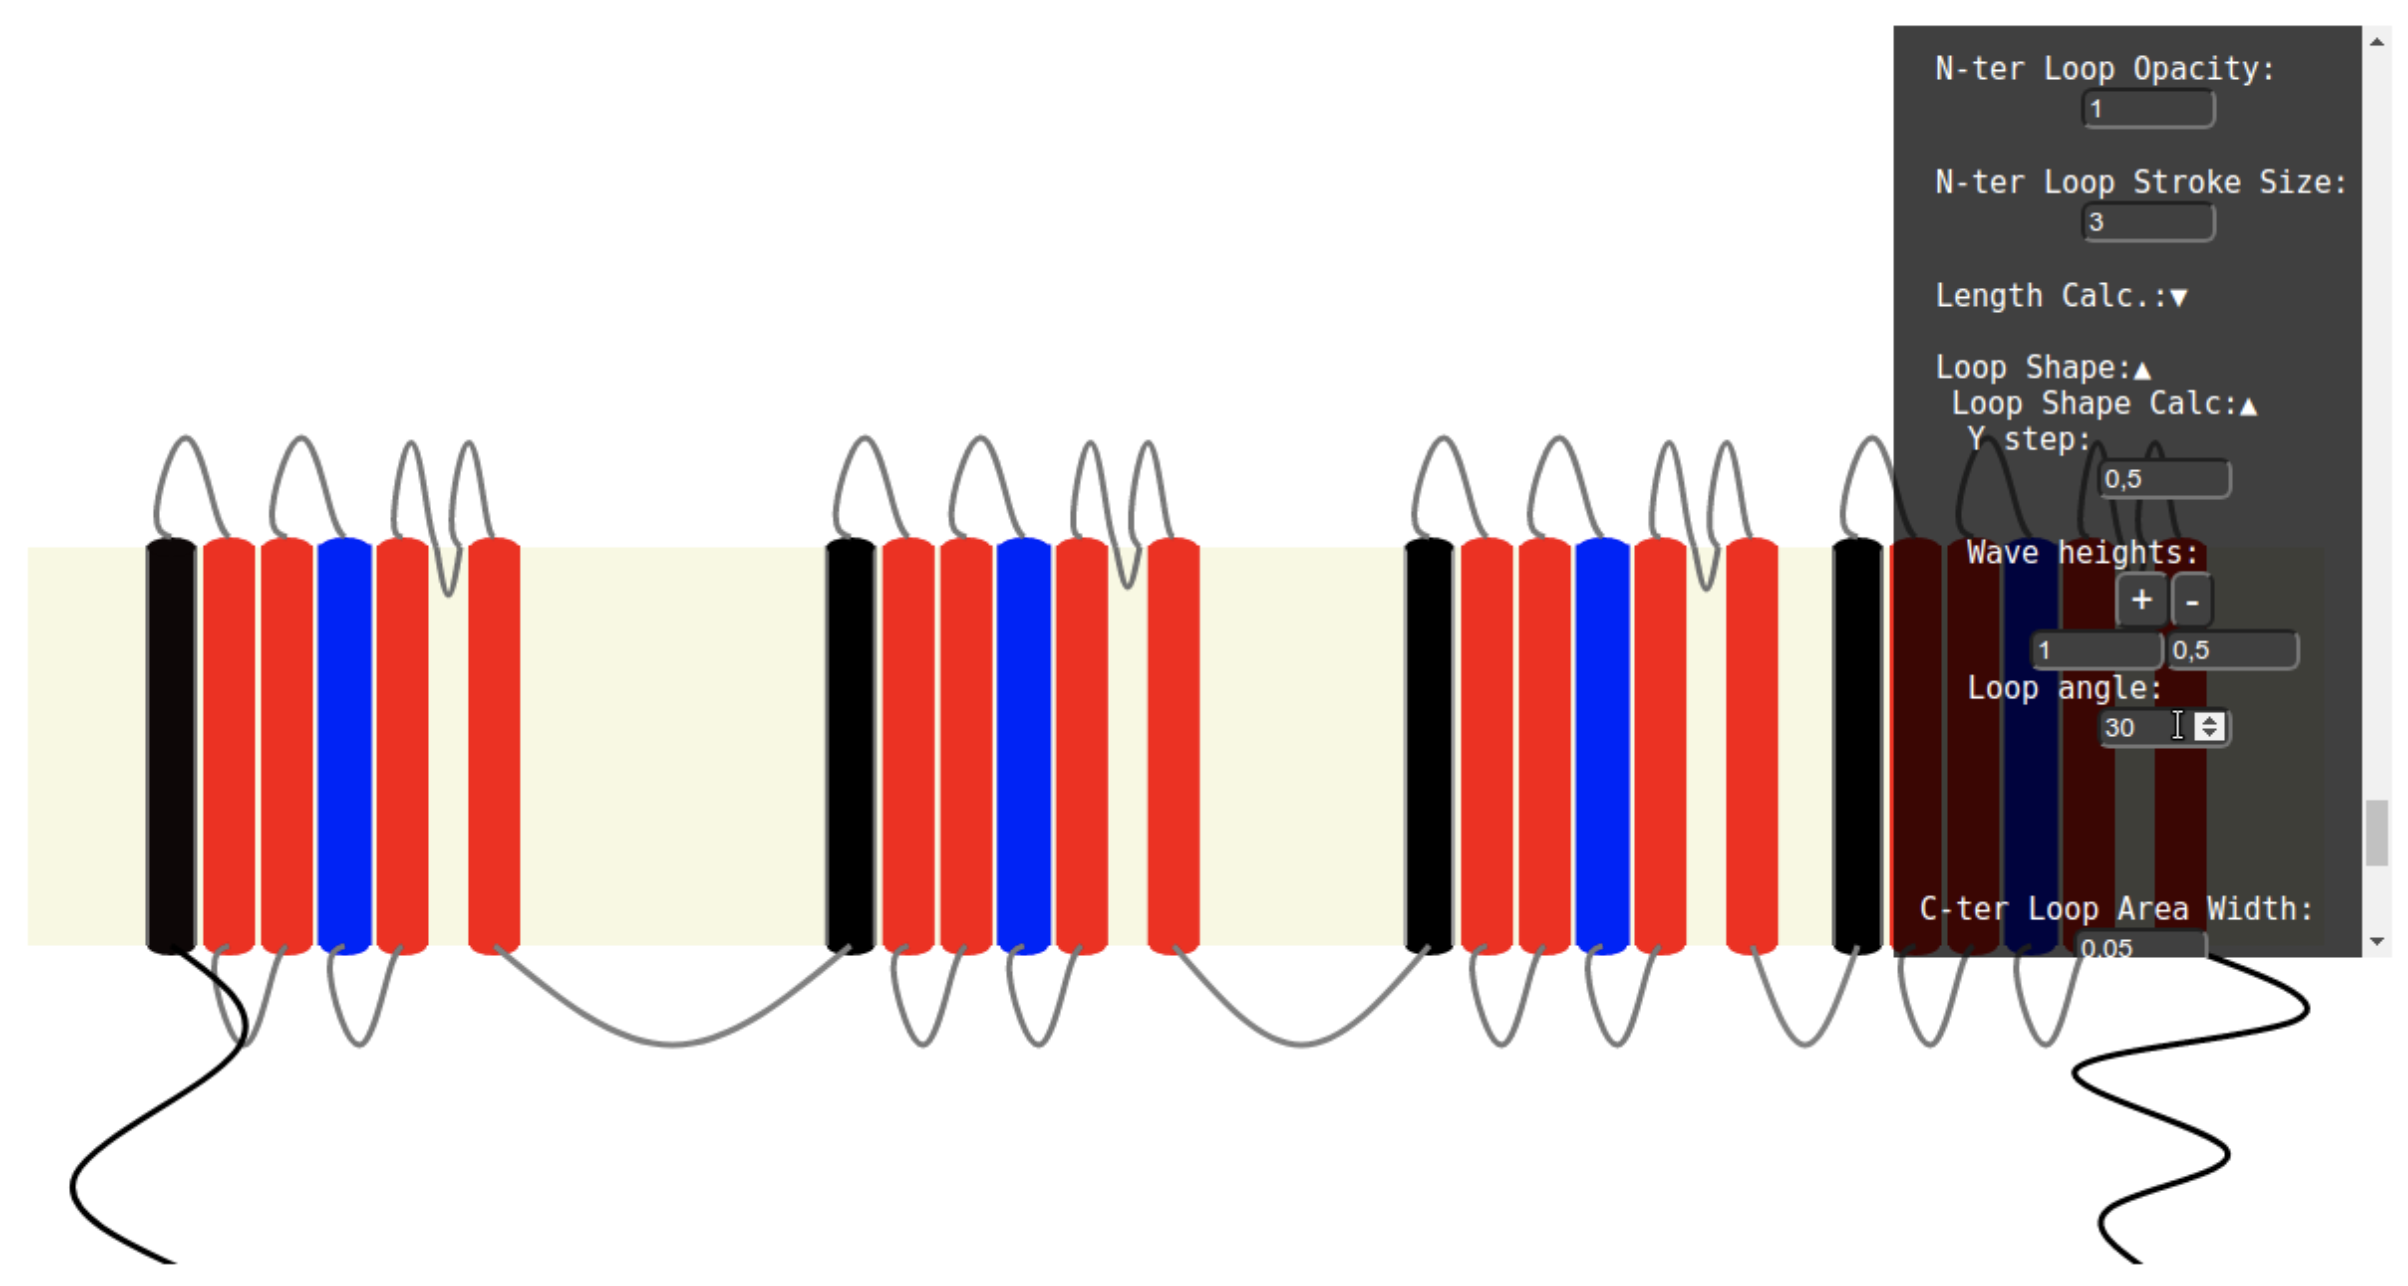
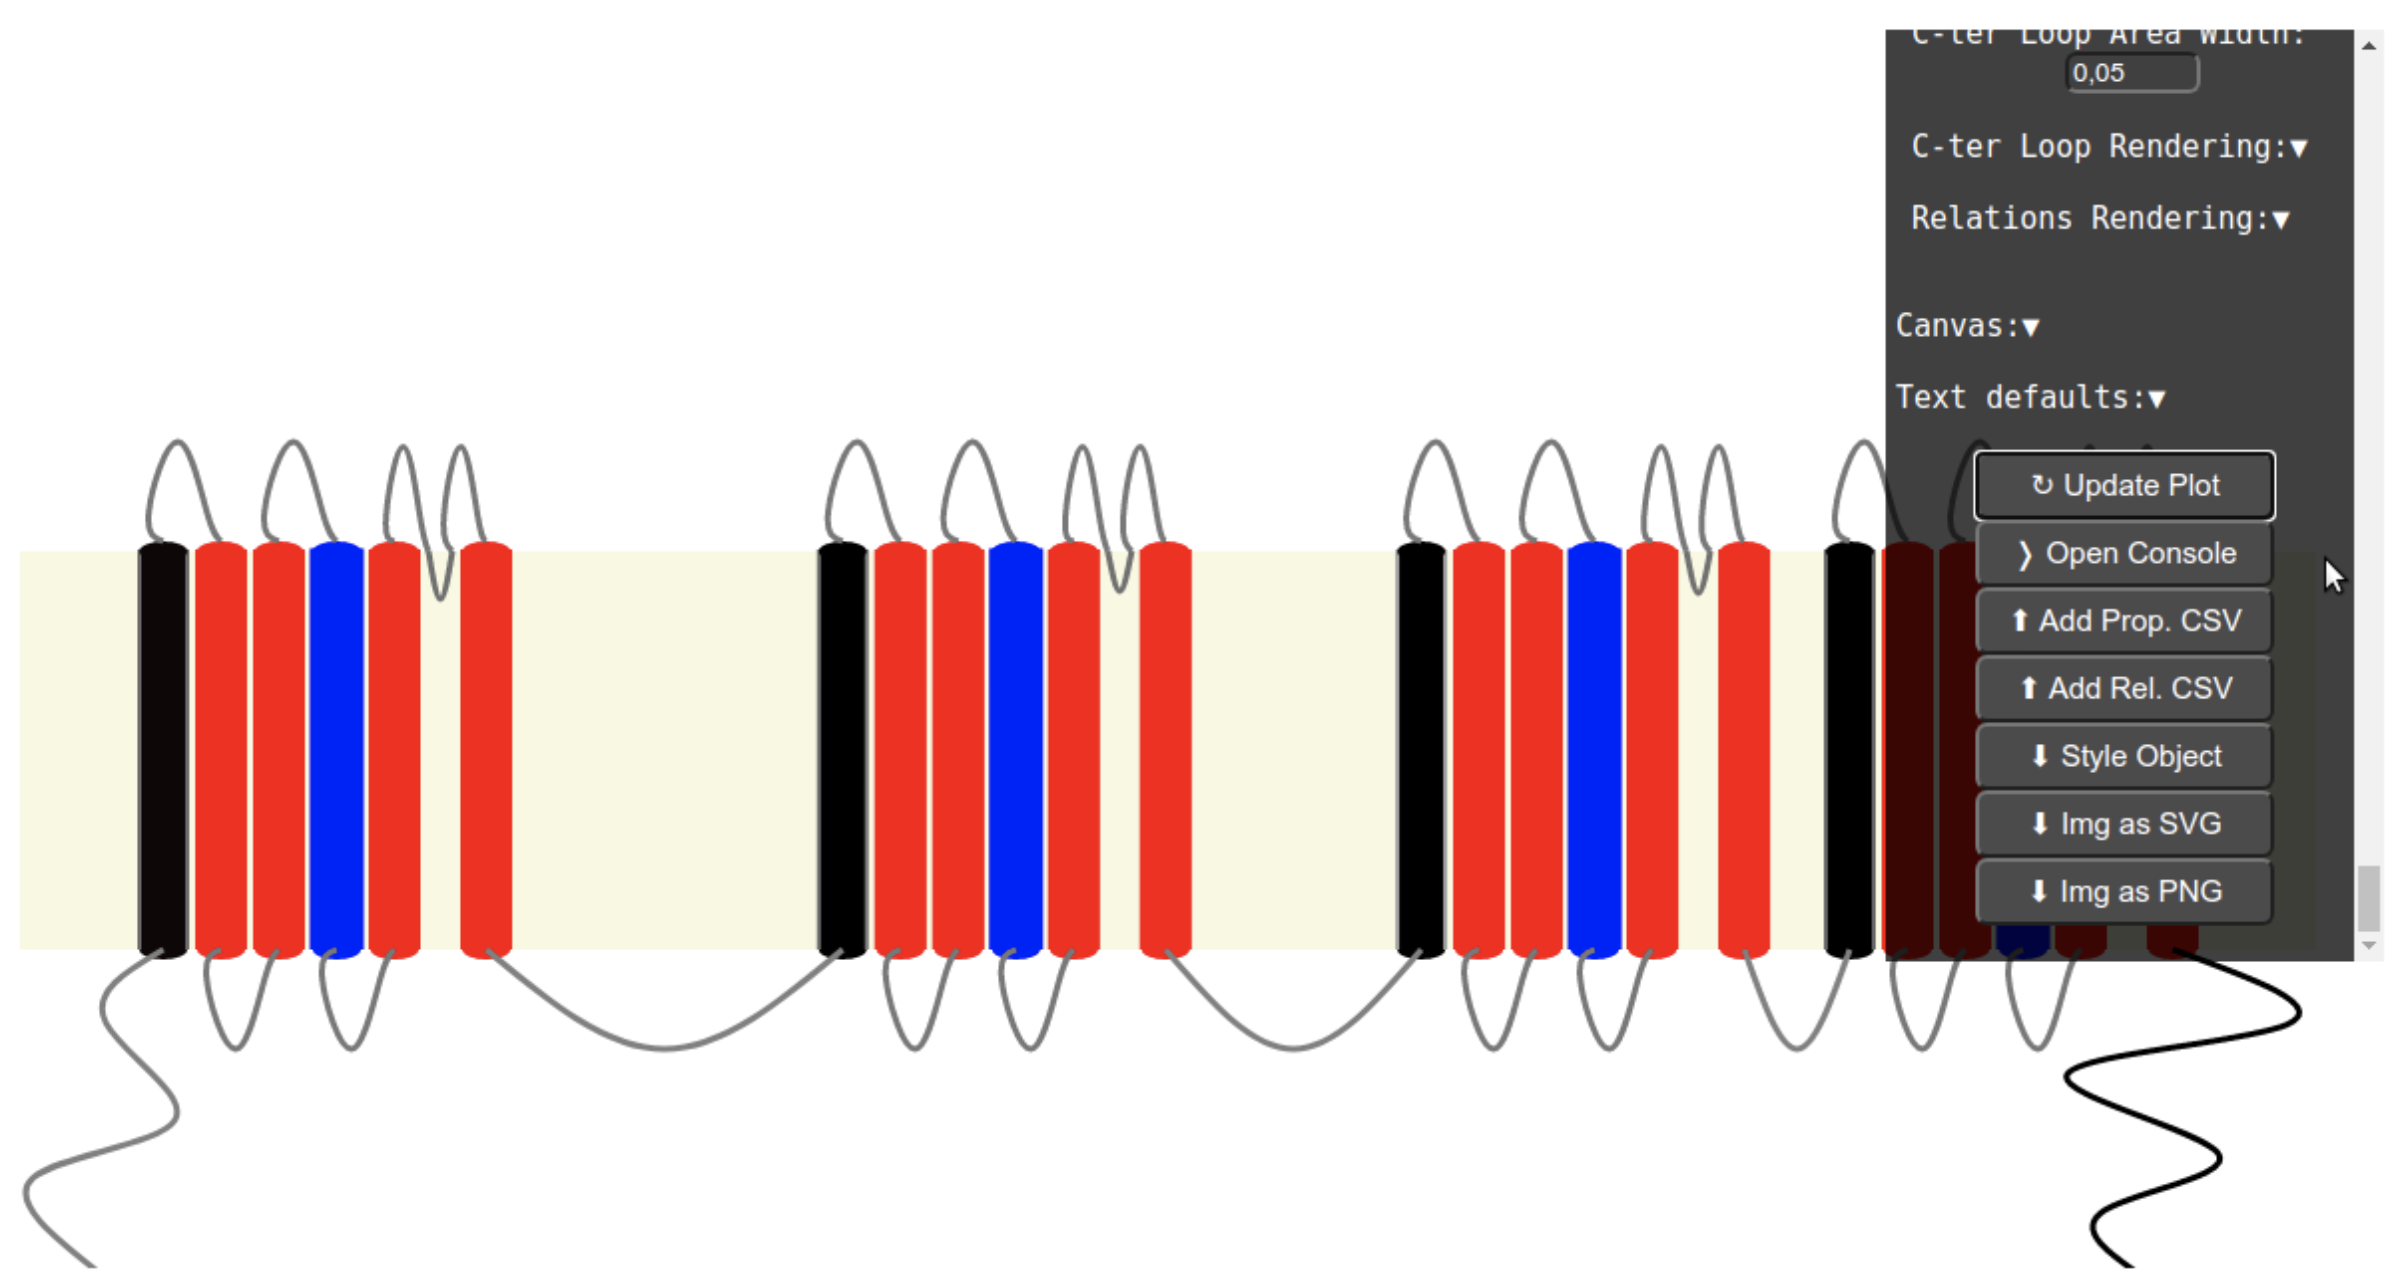
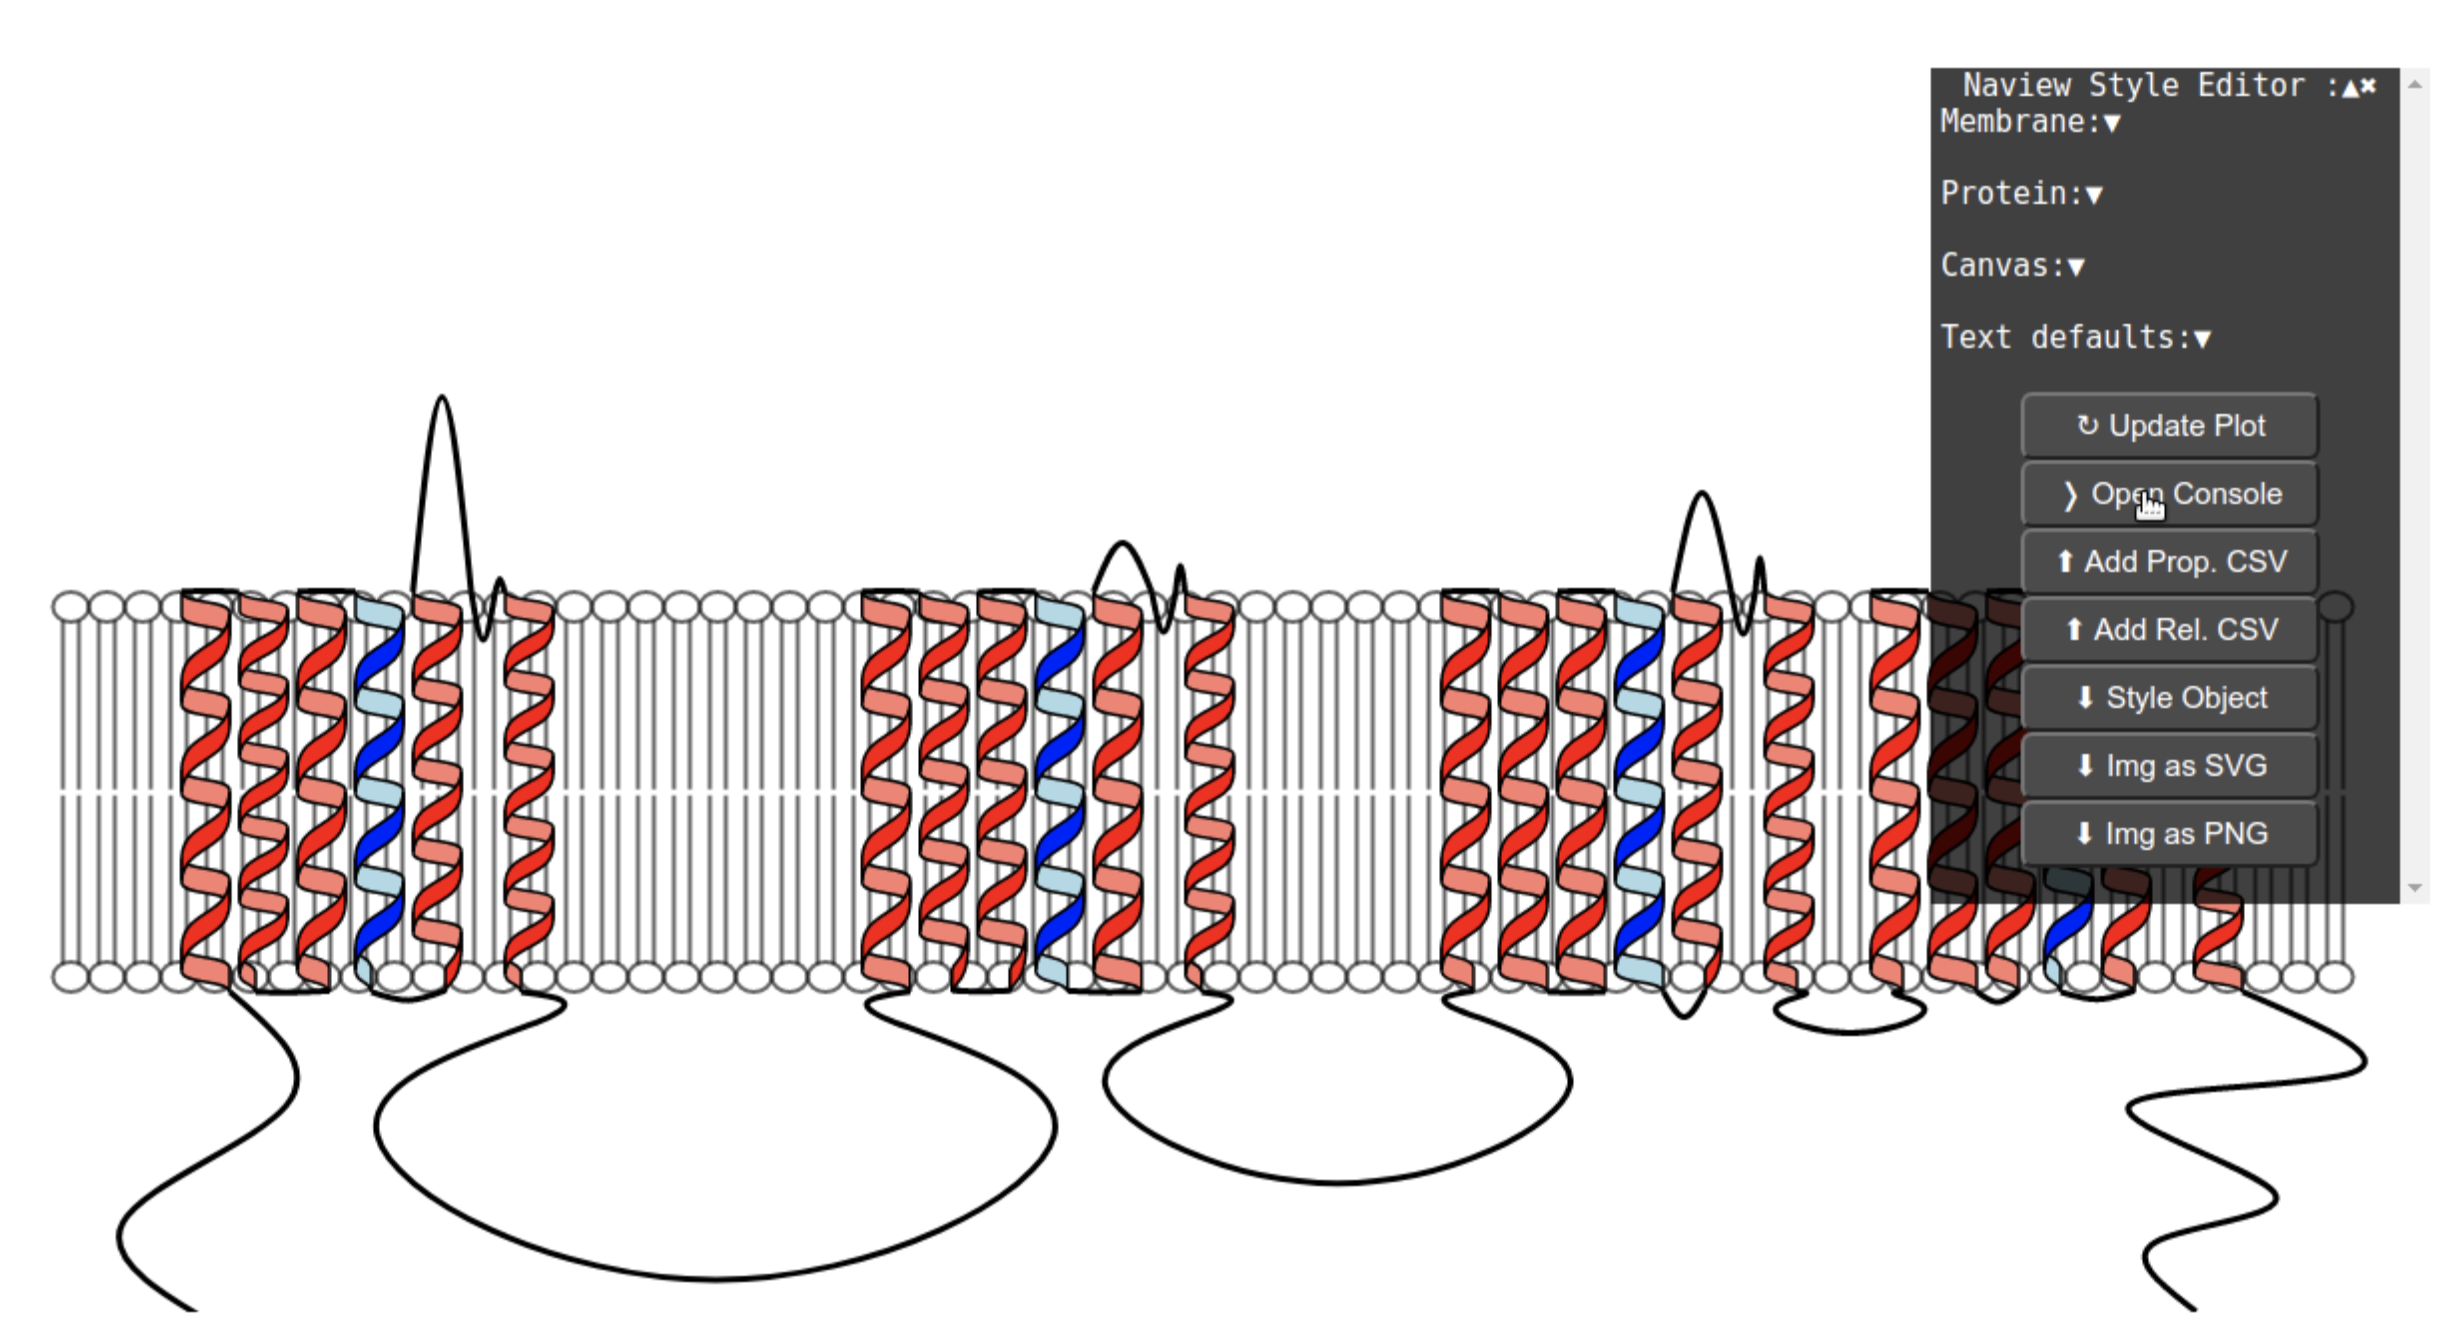
The style editor can be enabled with following commands:
The full documentation can be found here
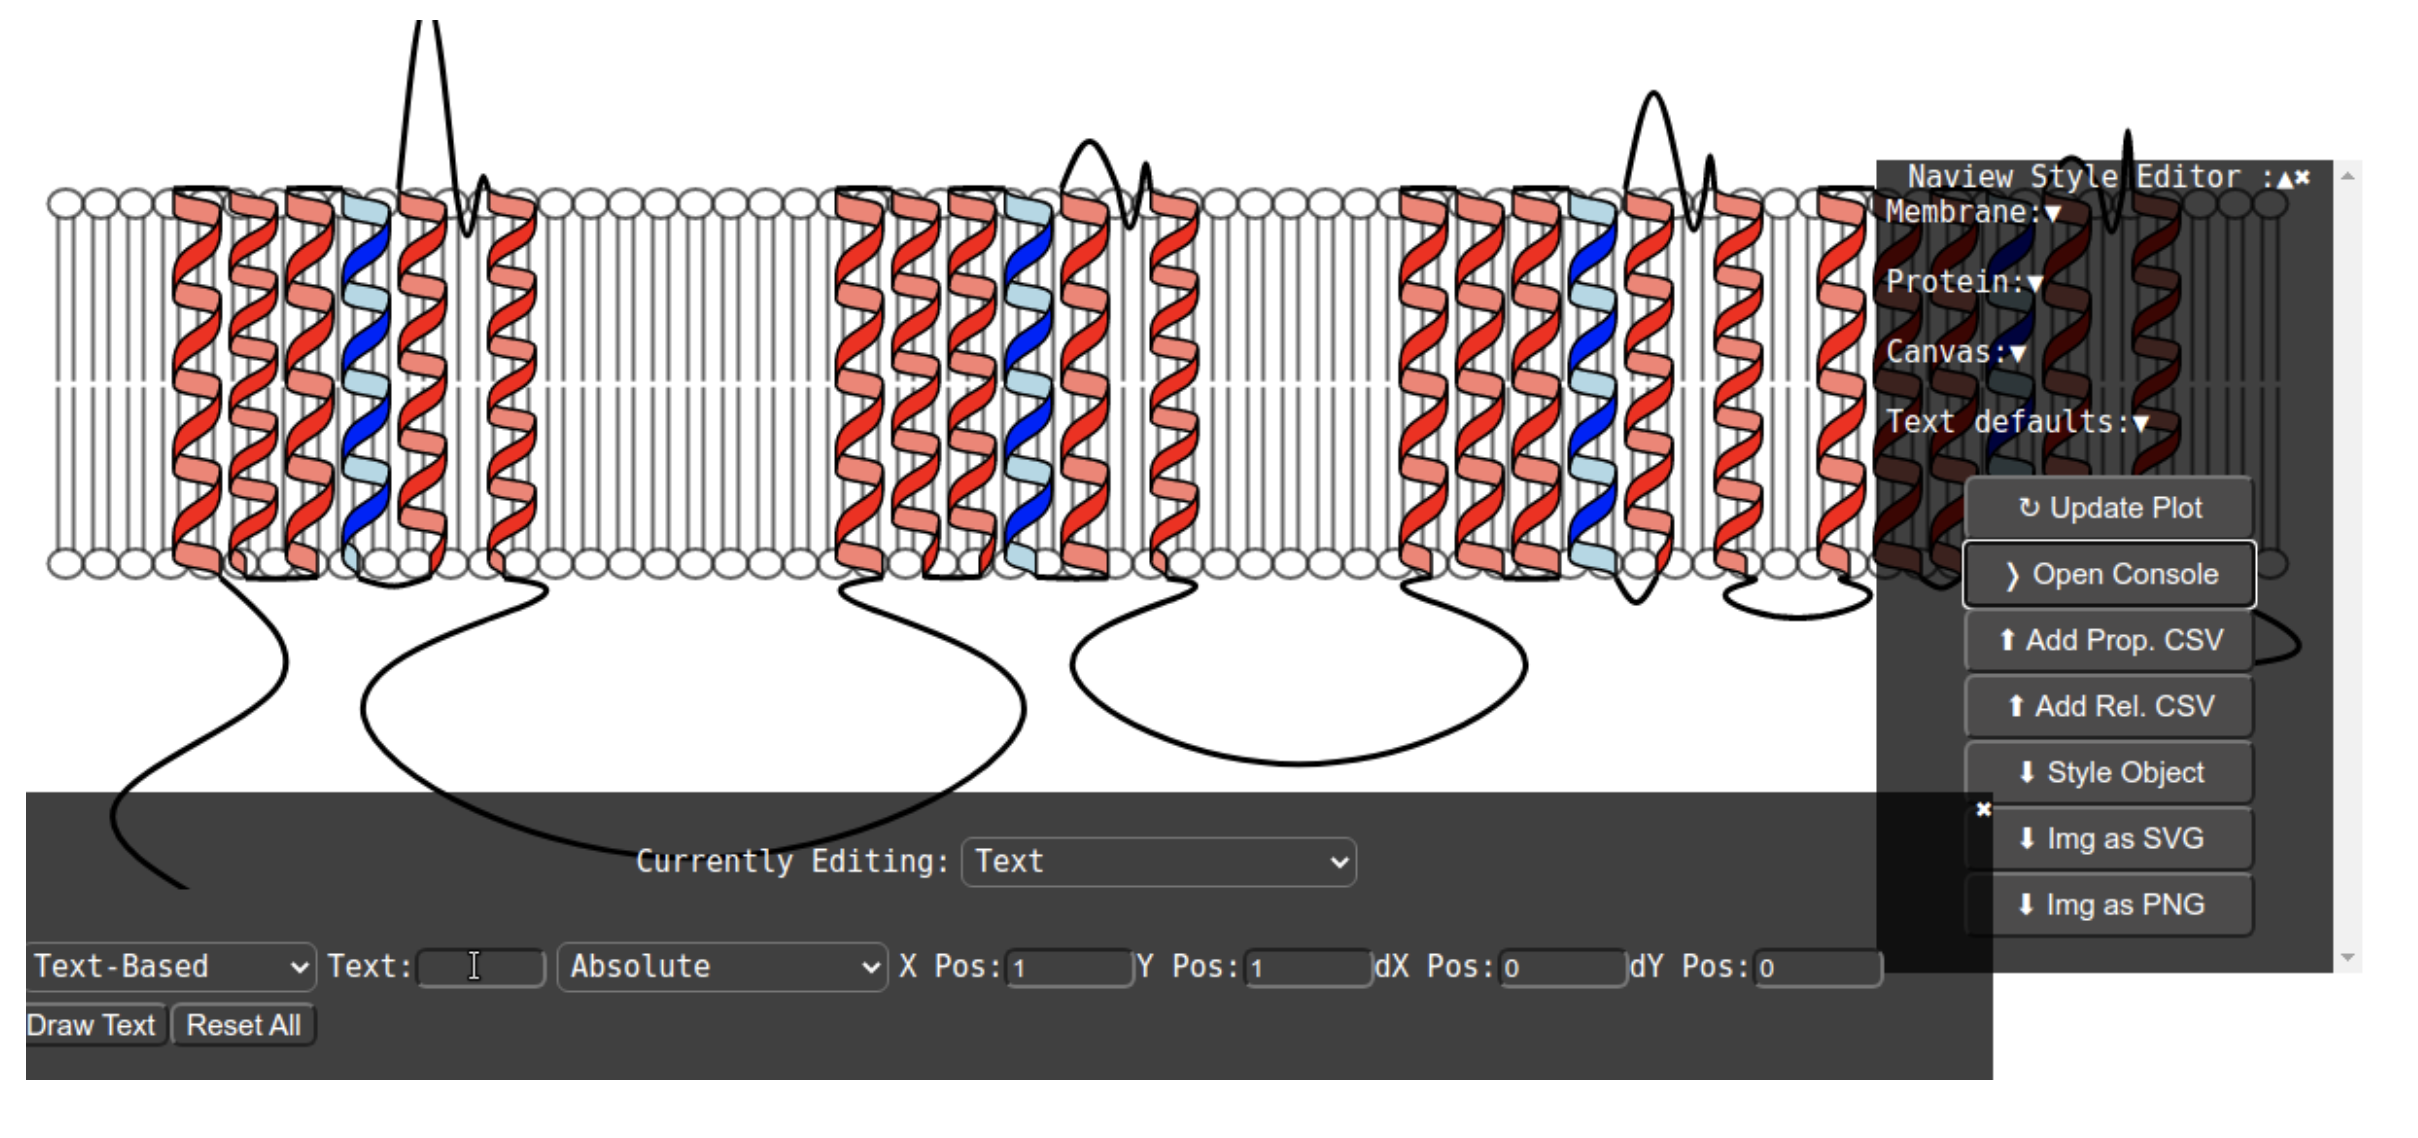
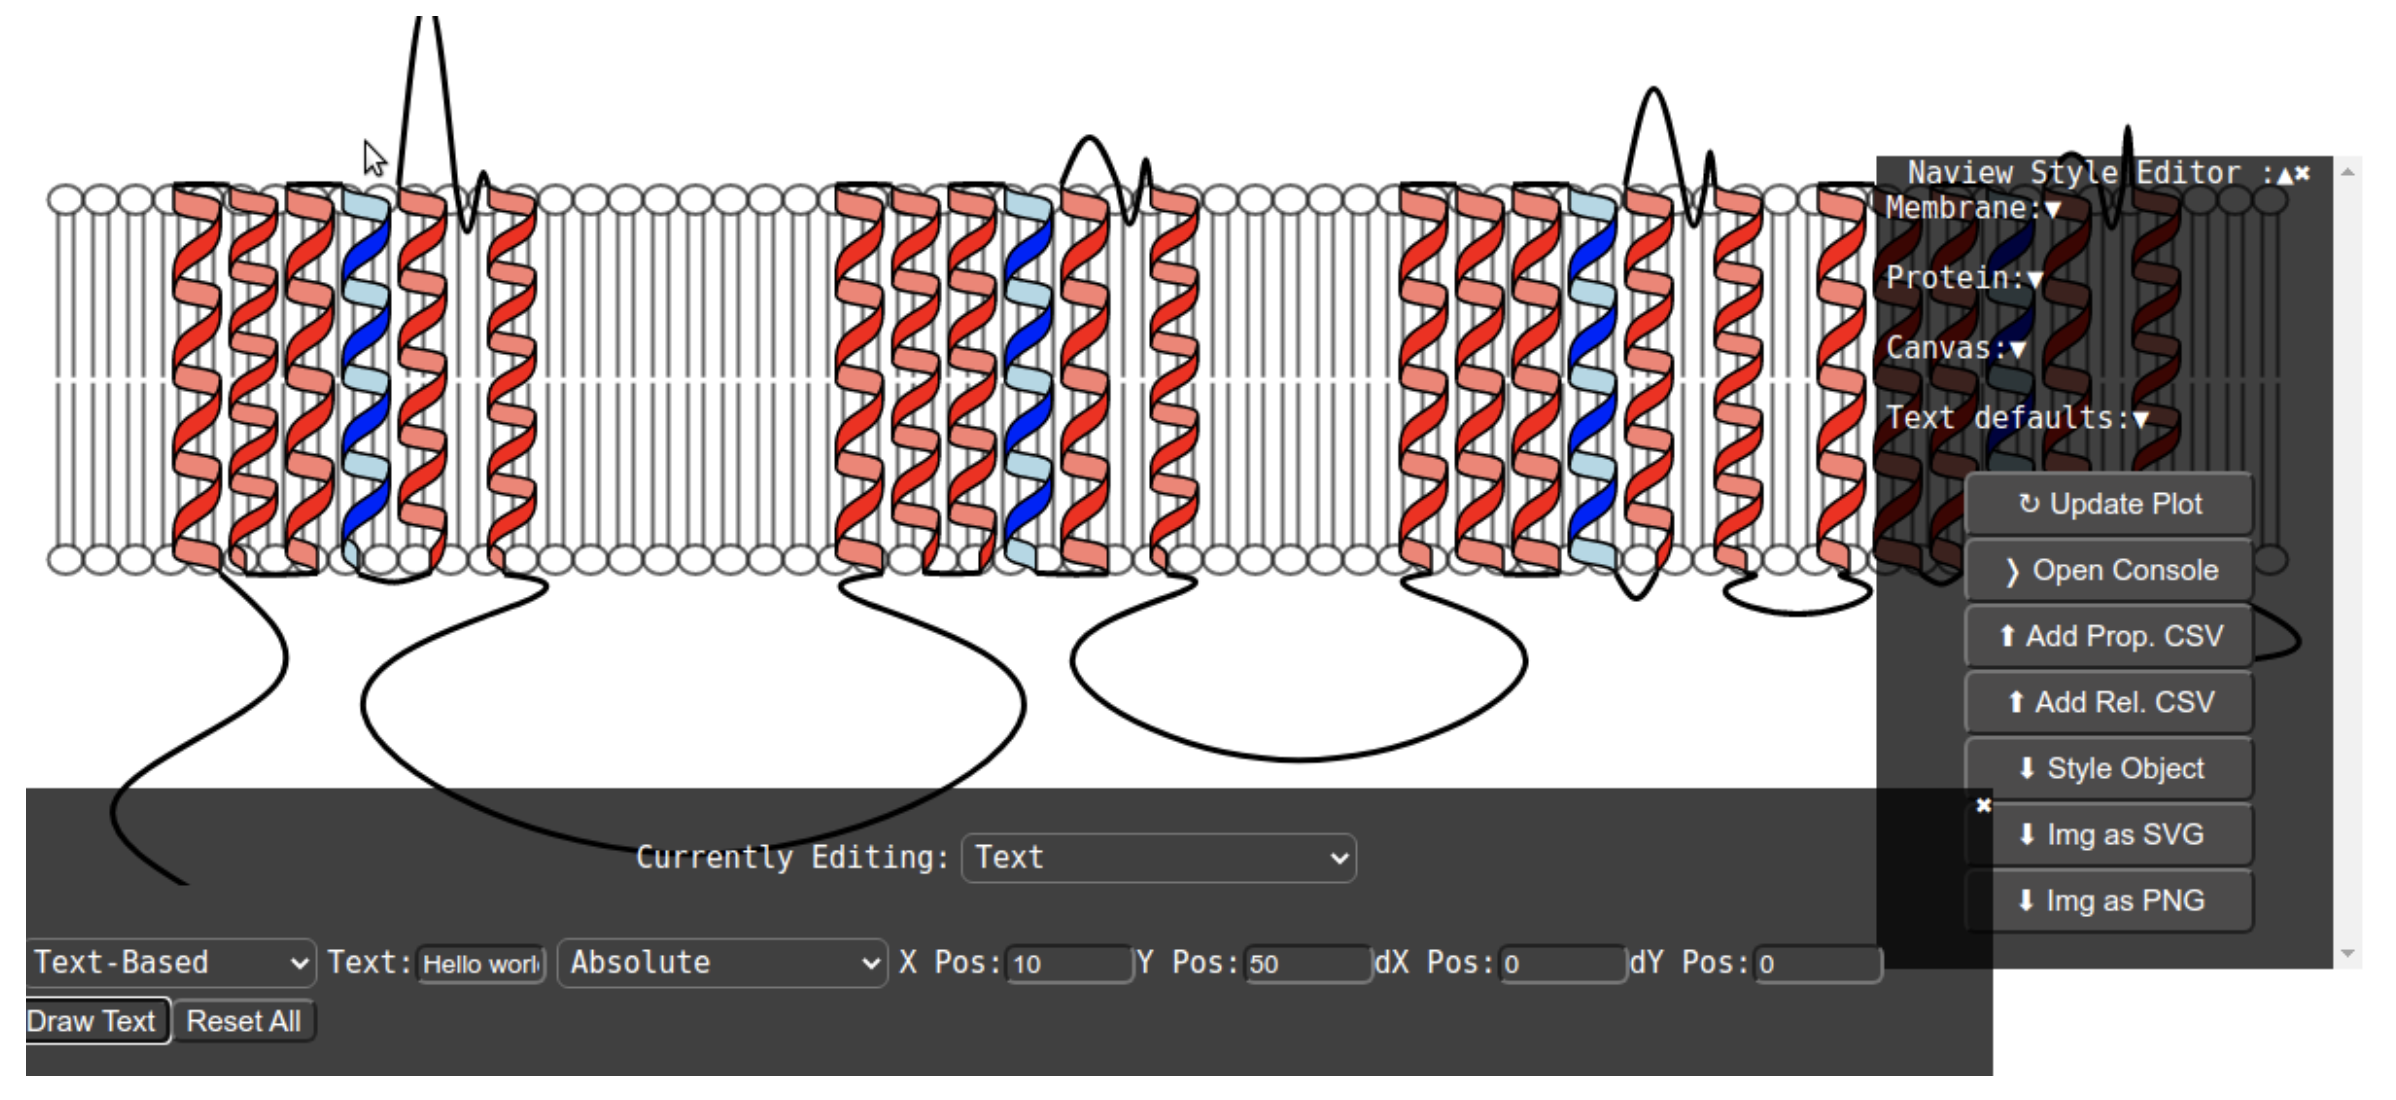
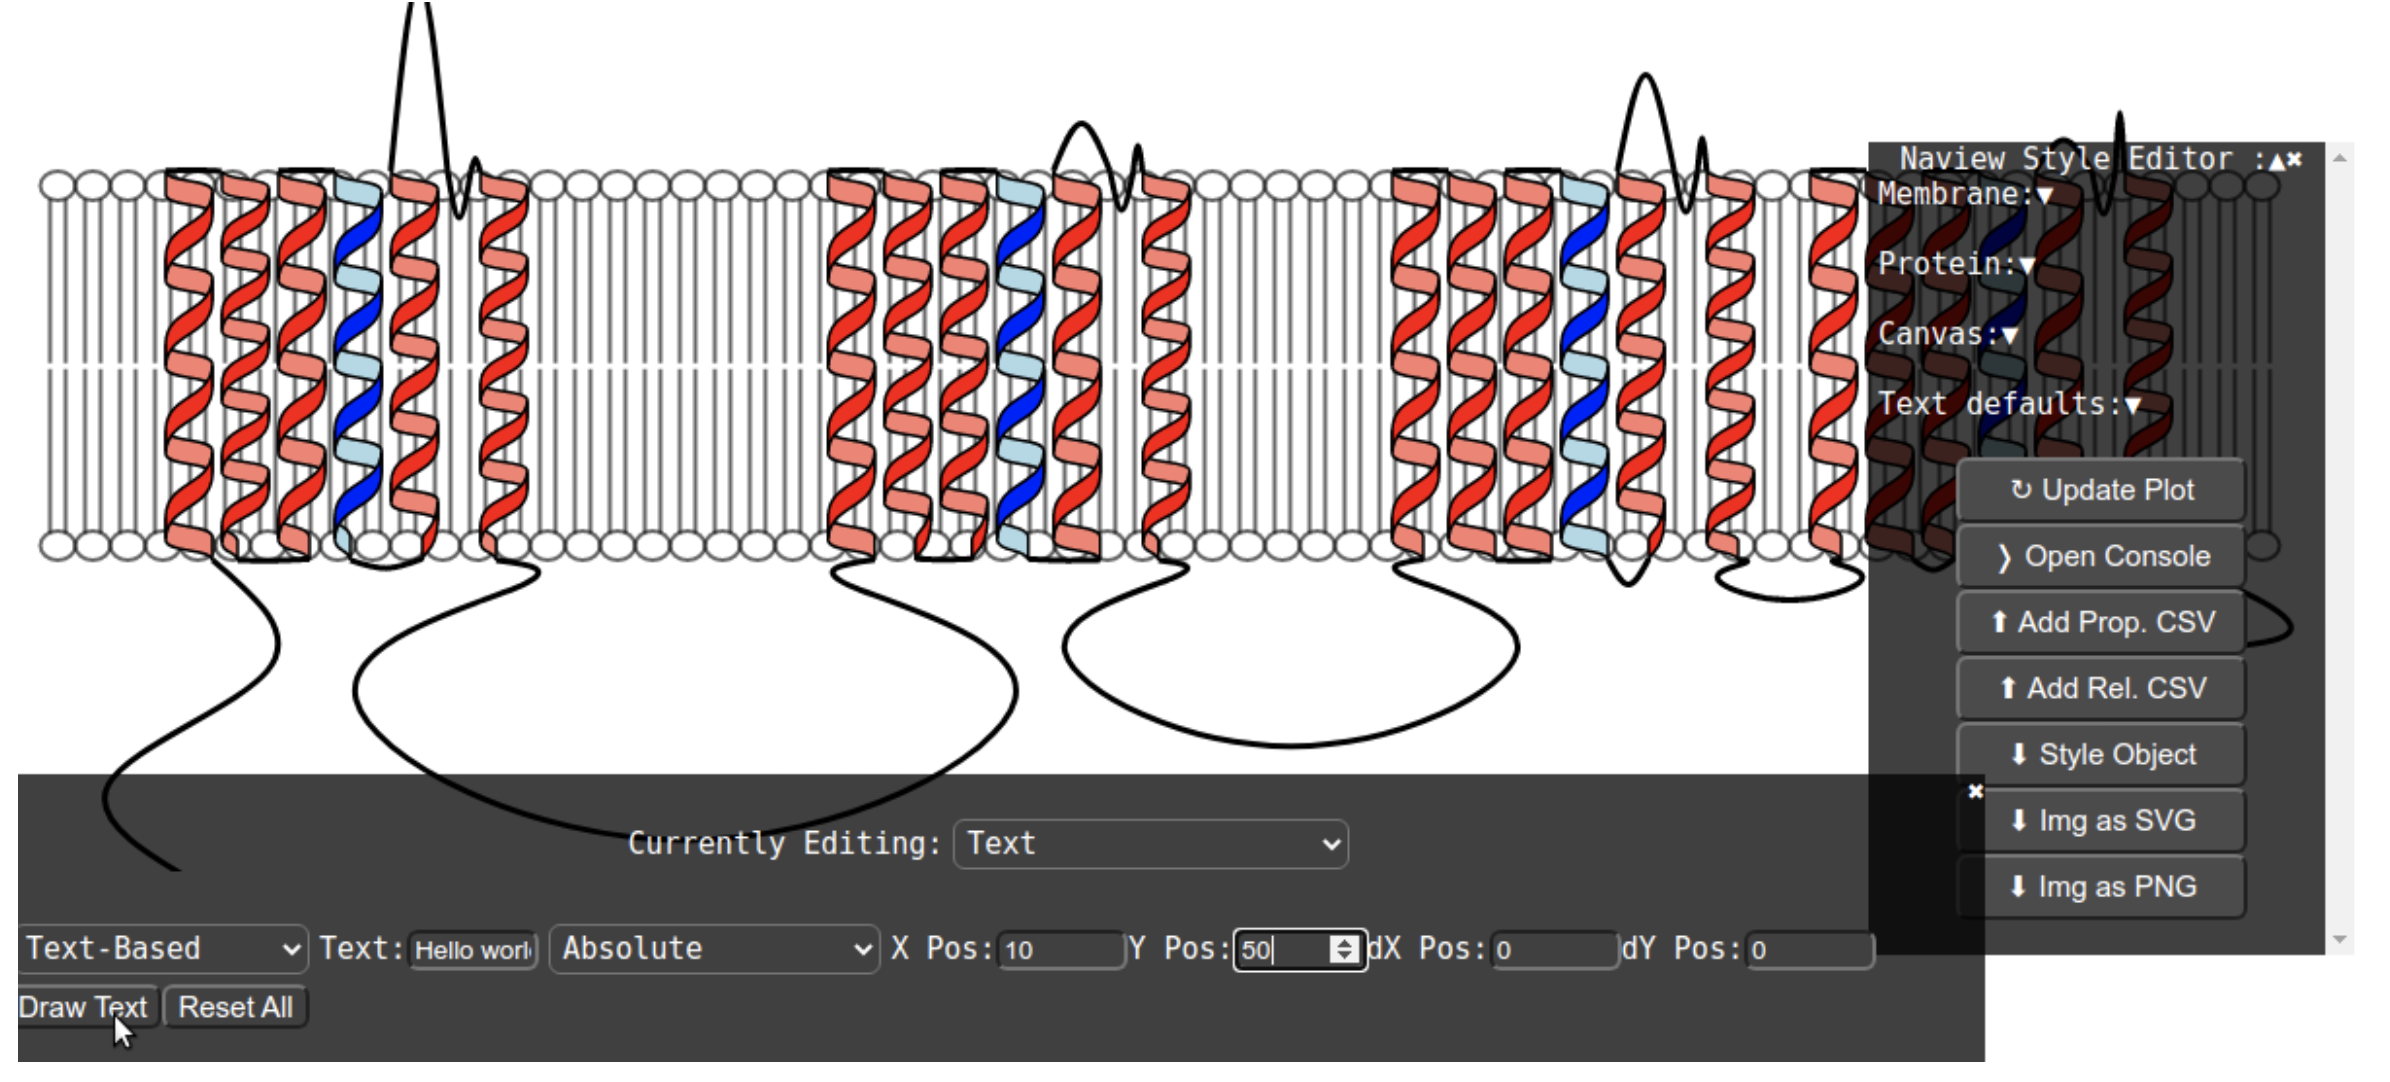
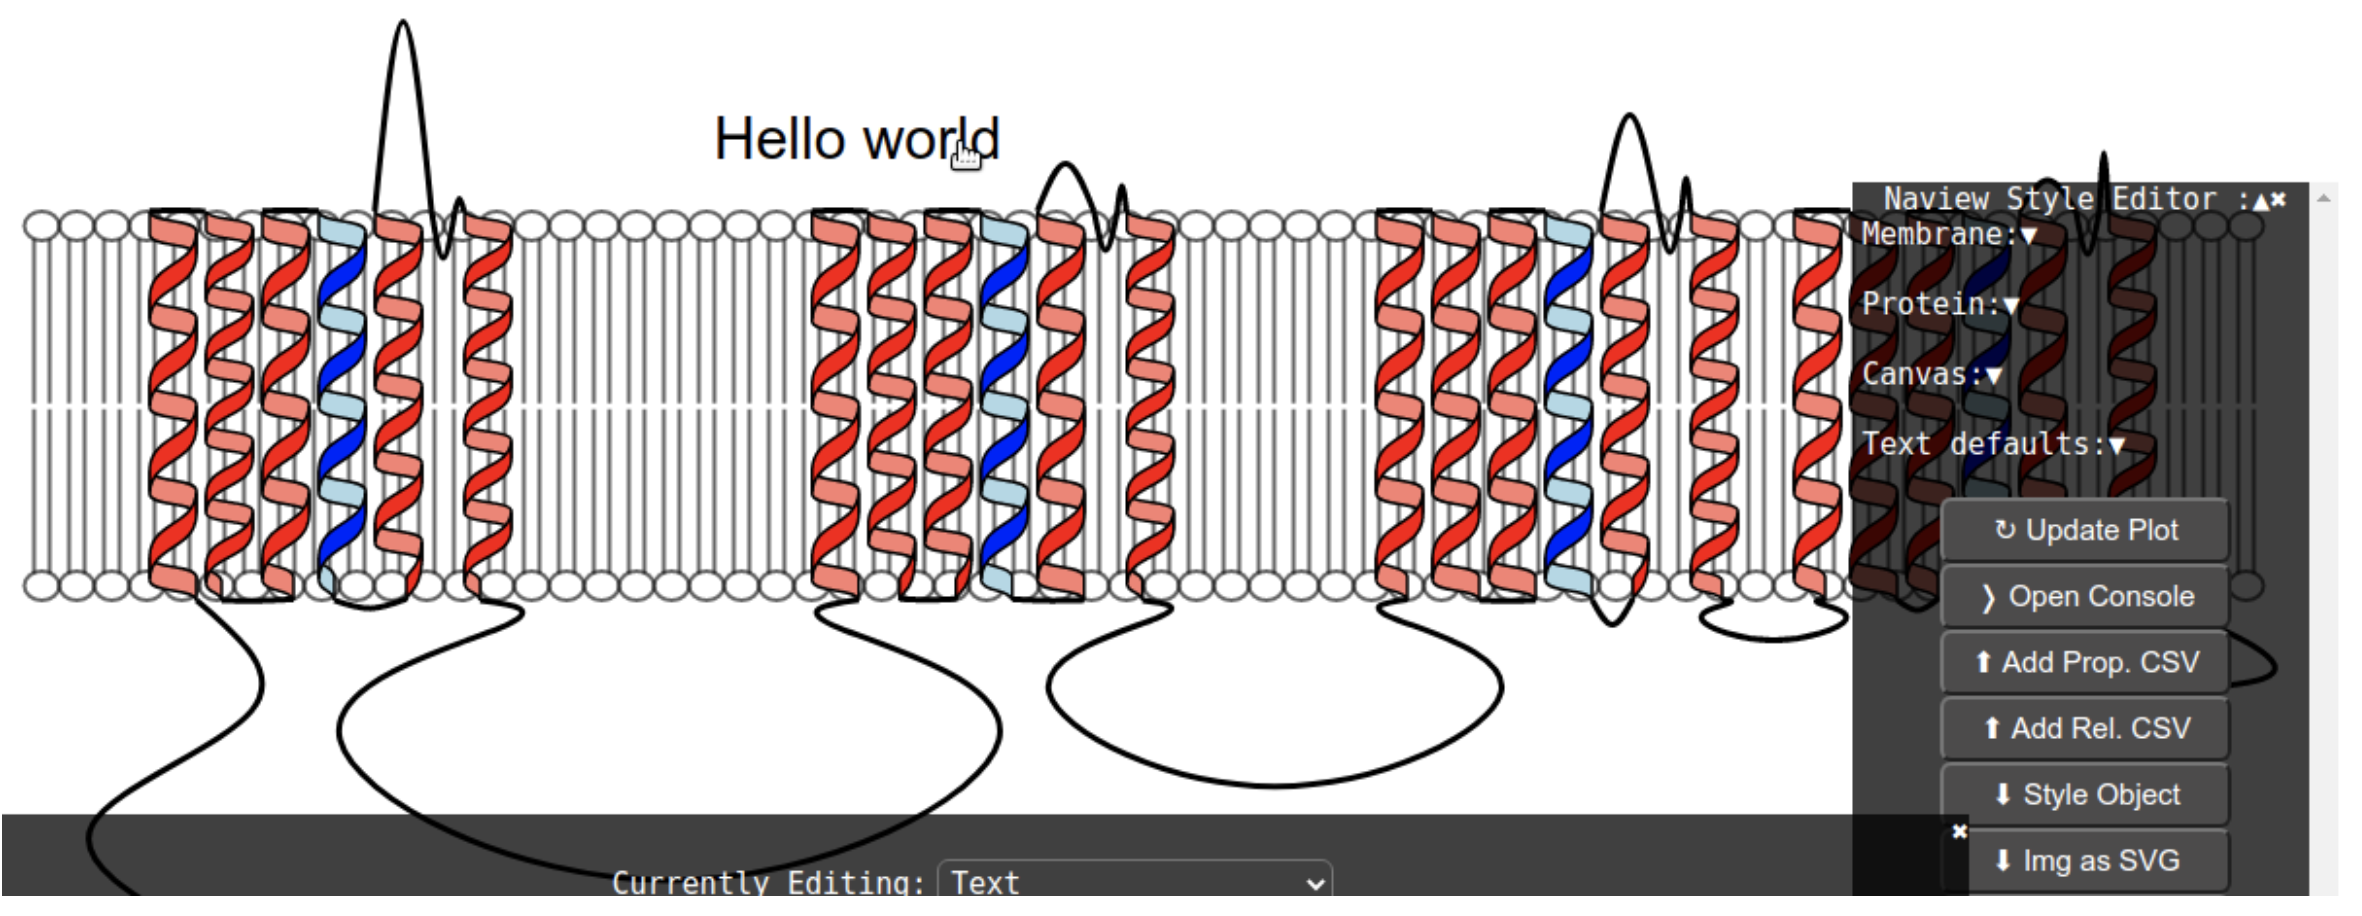
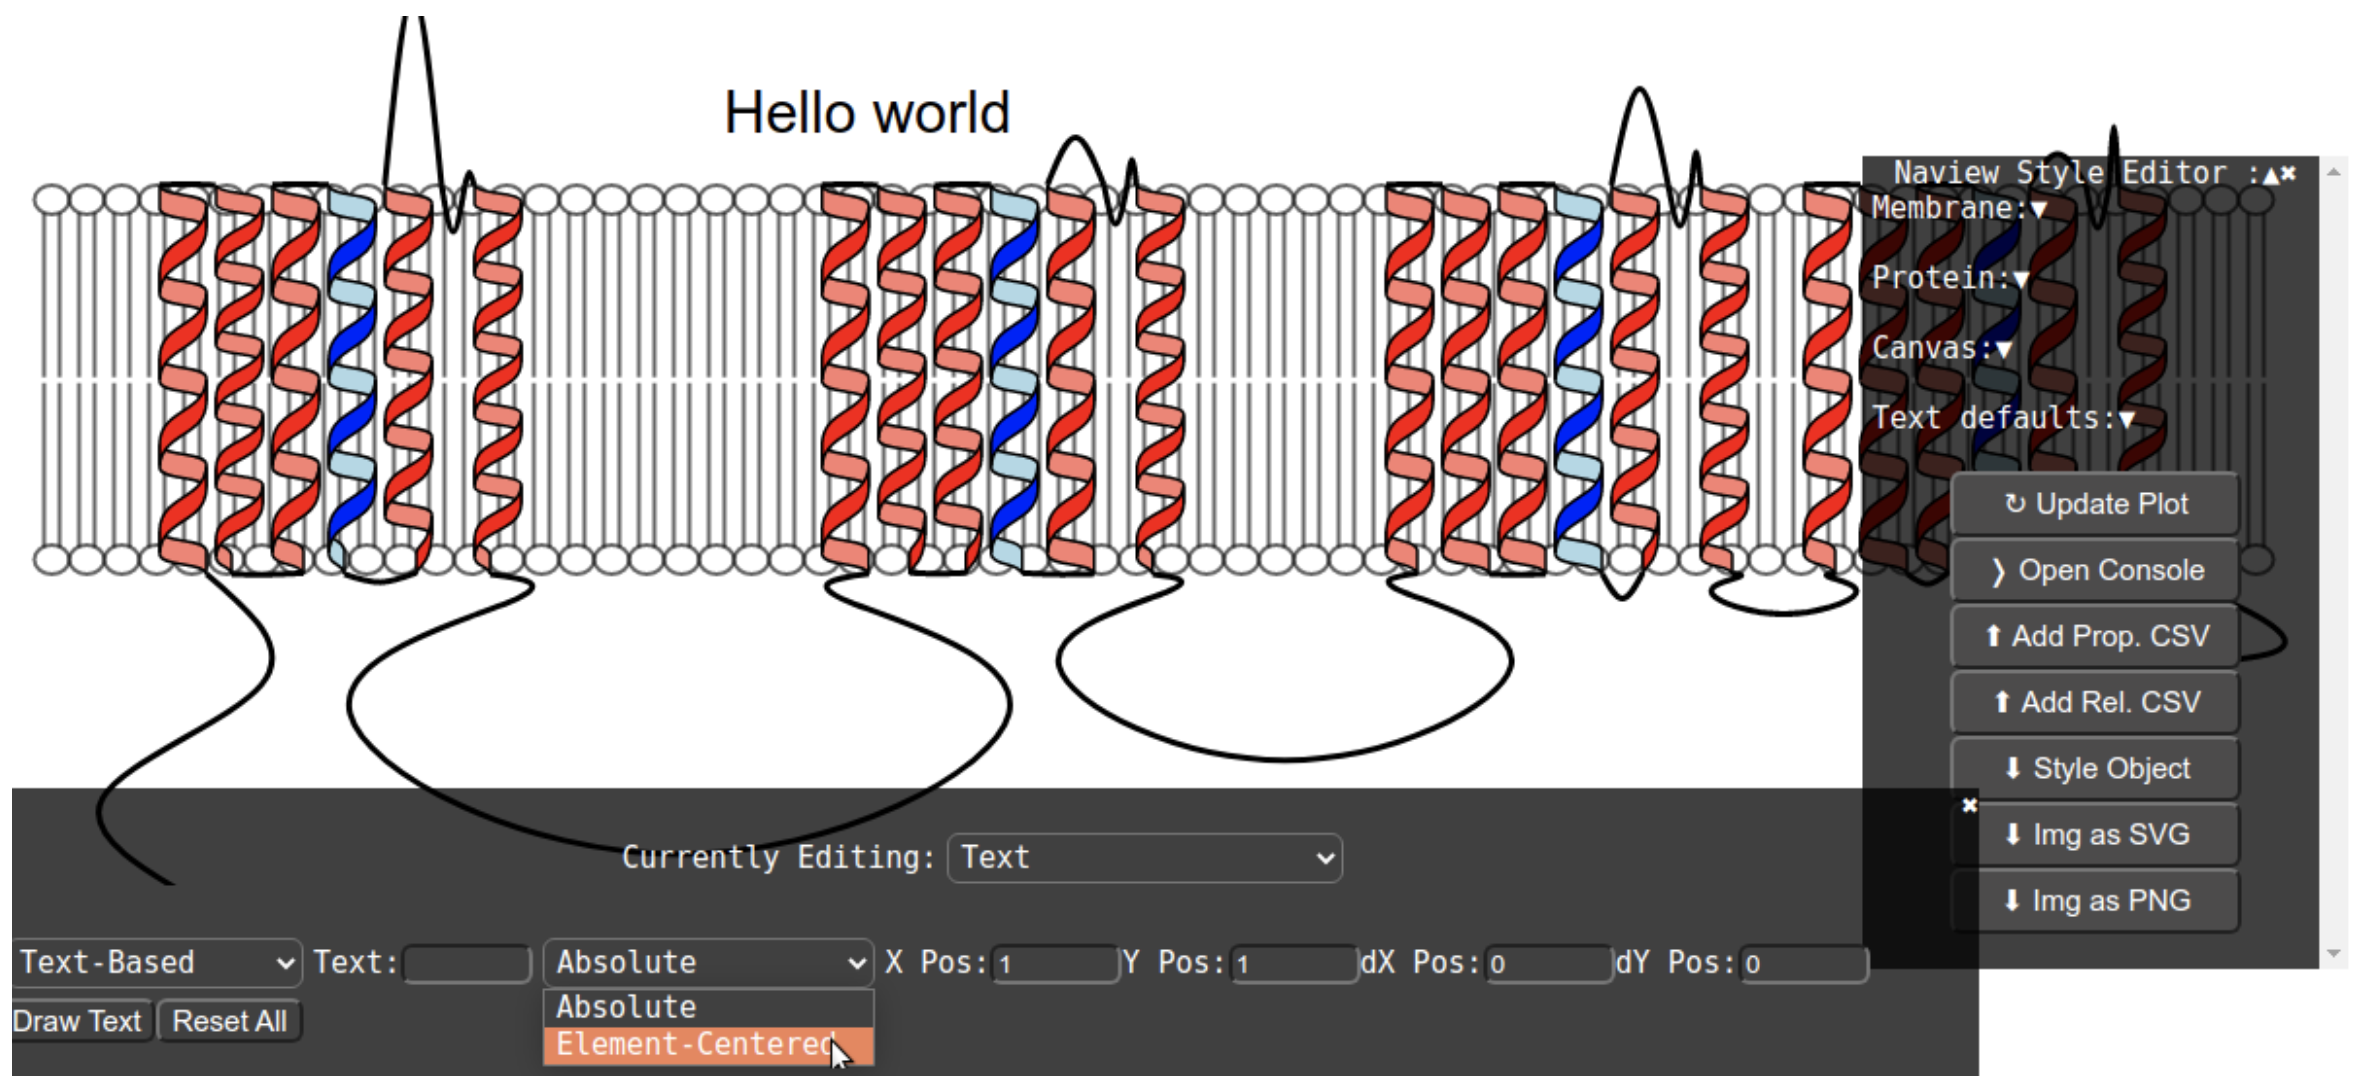
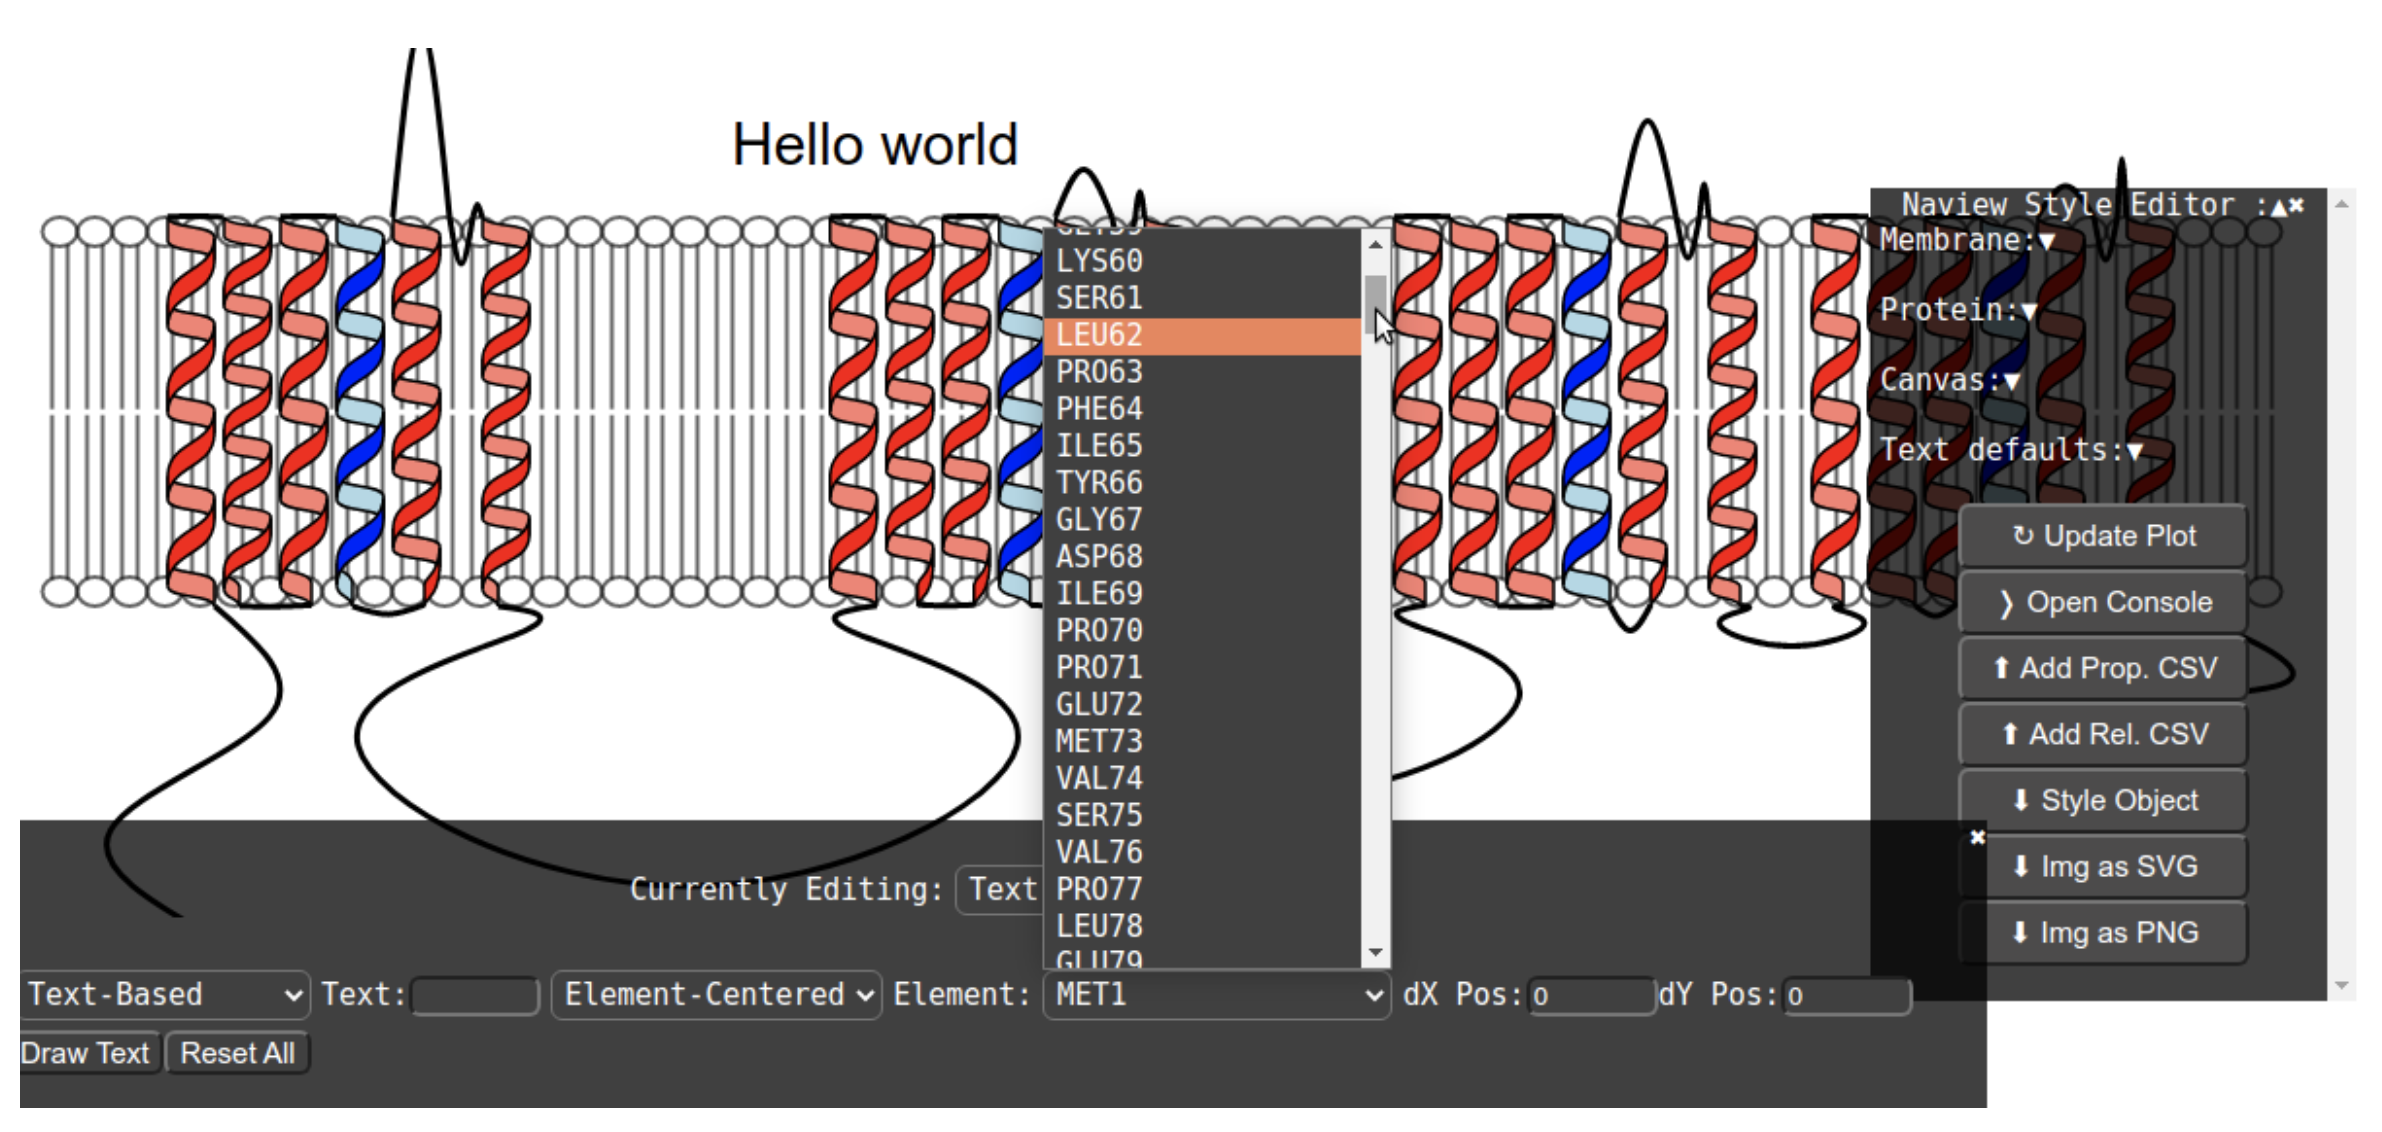
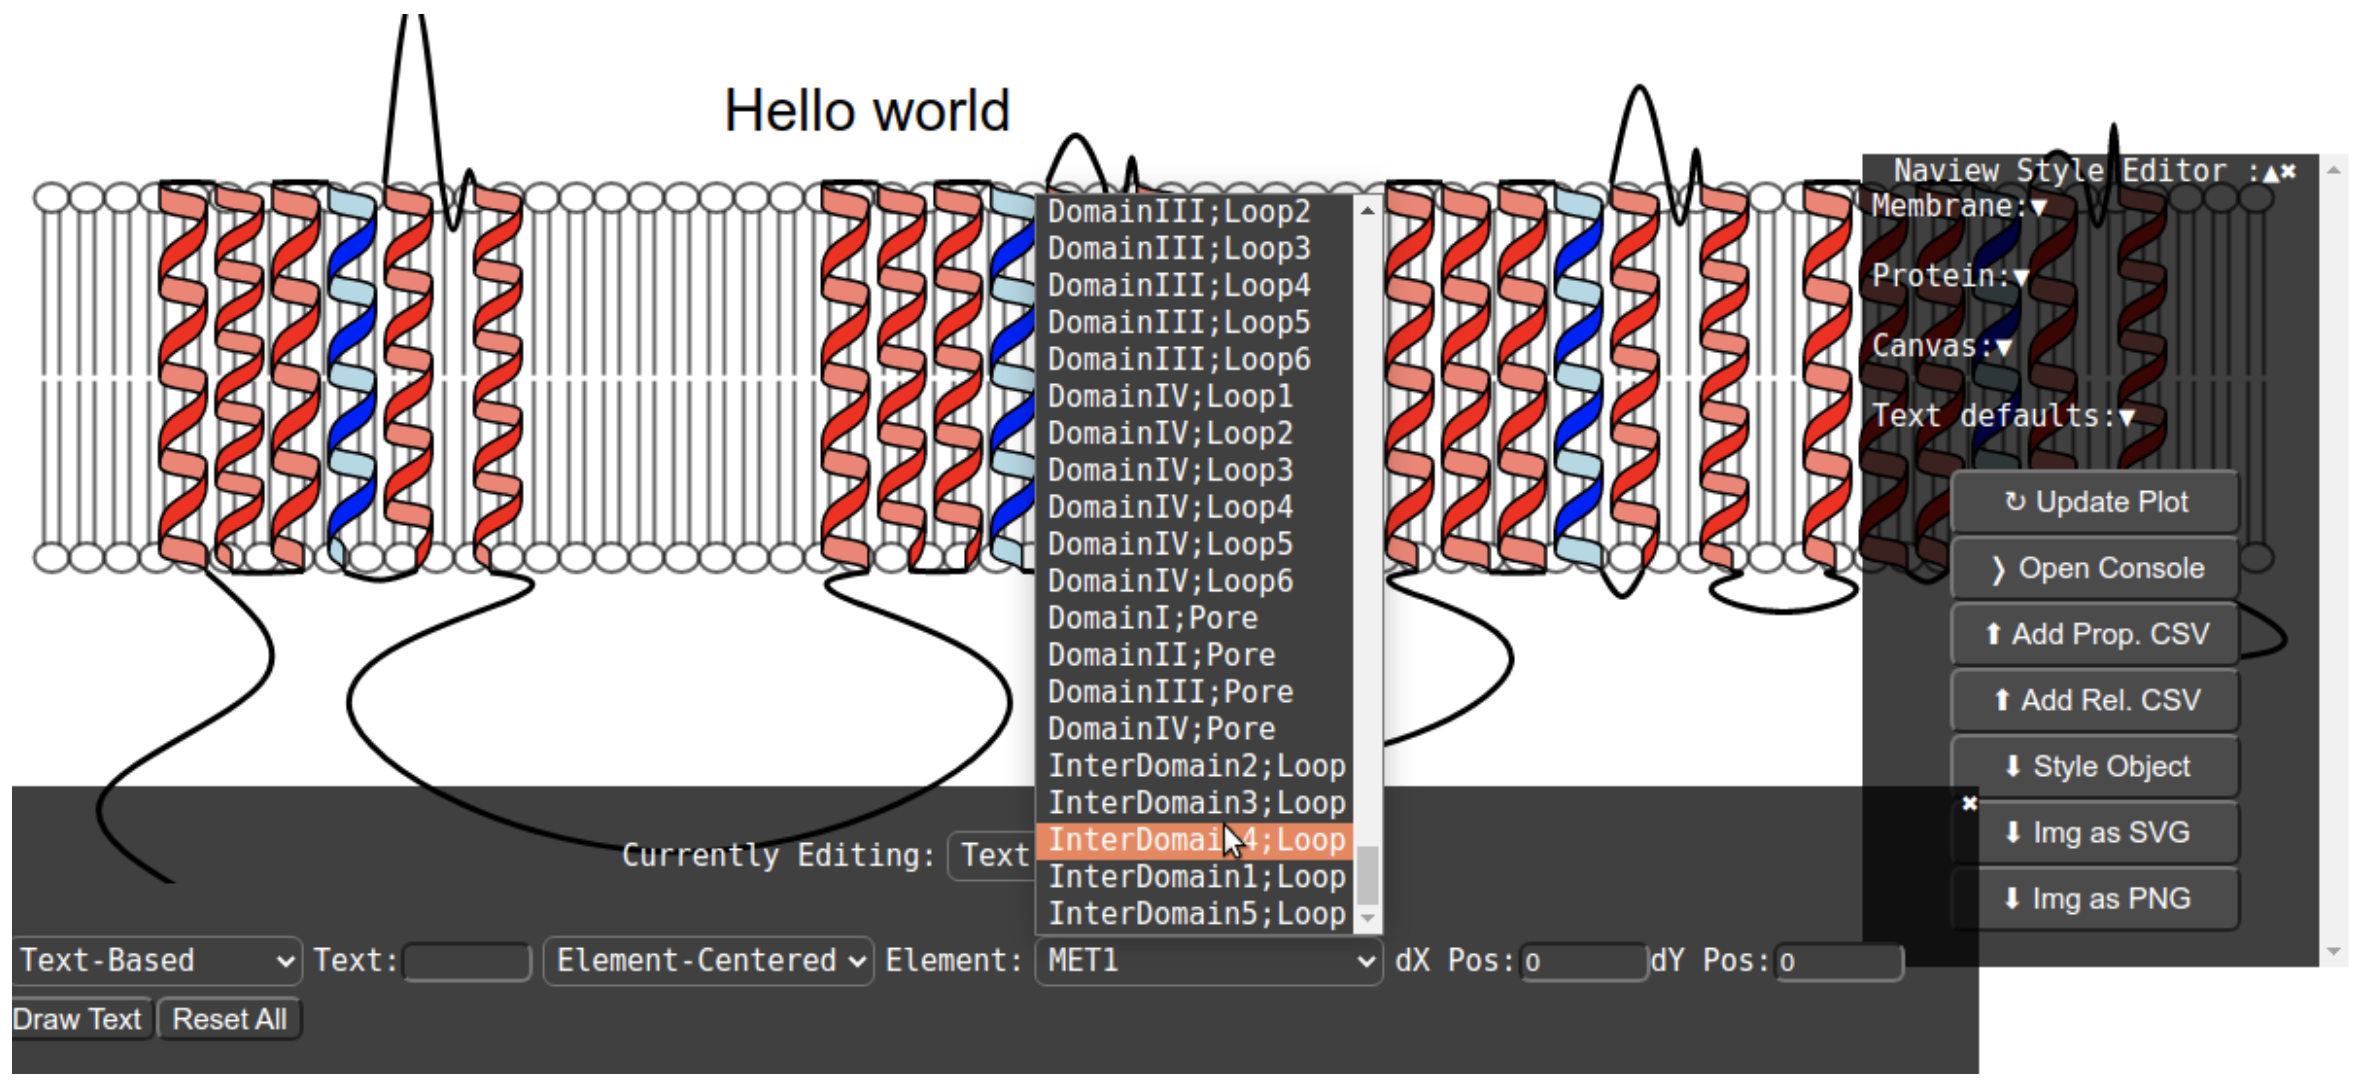
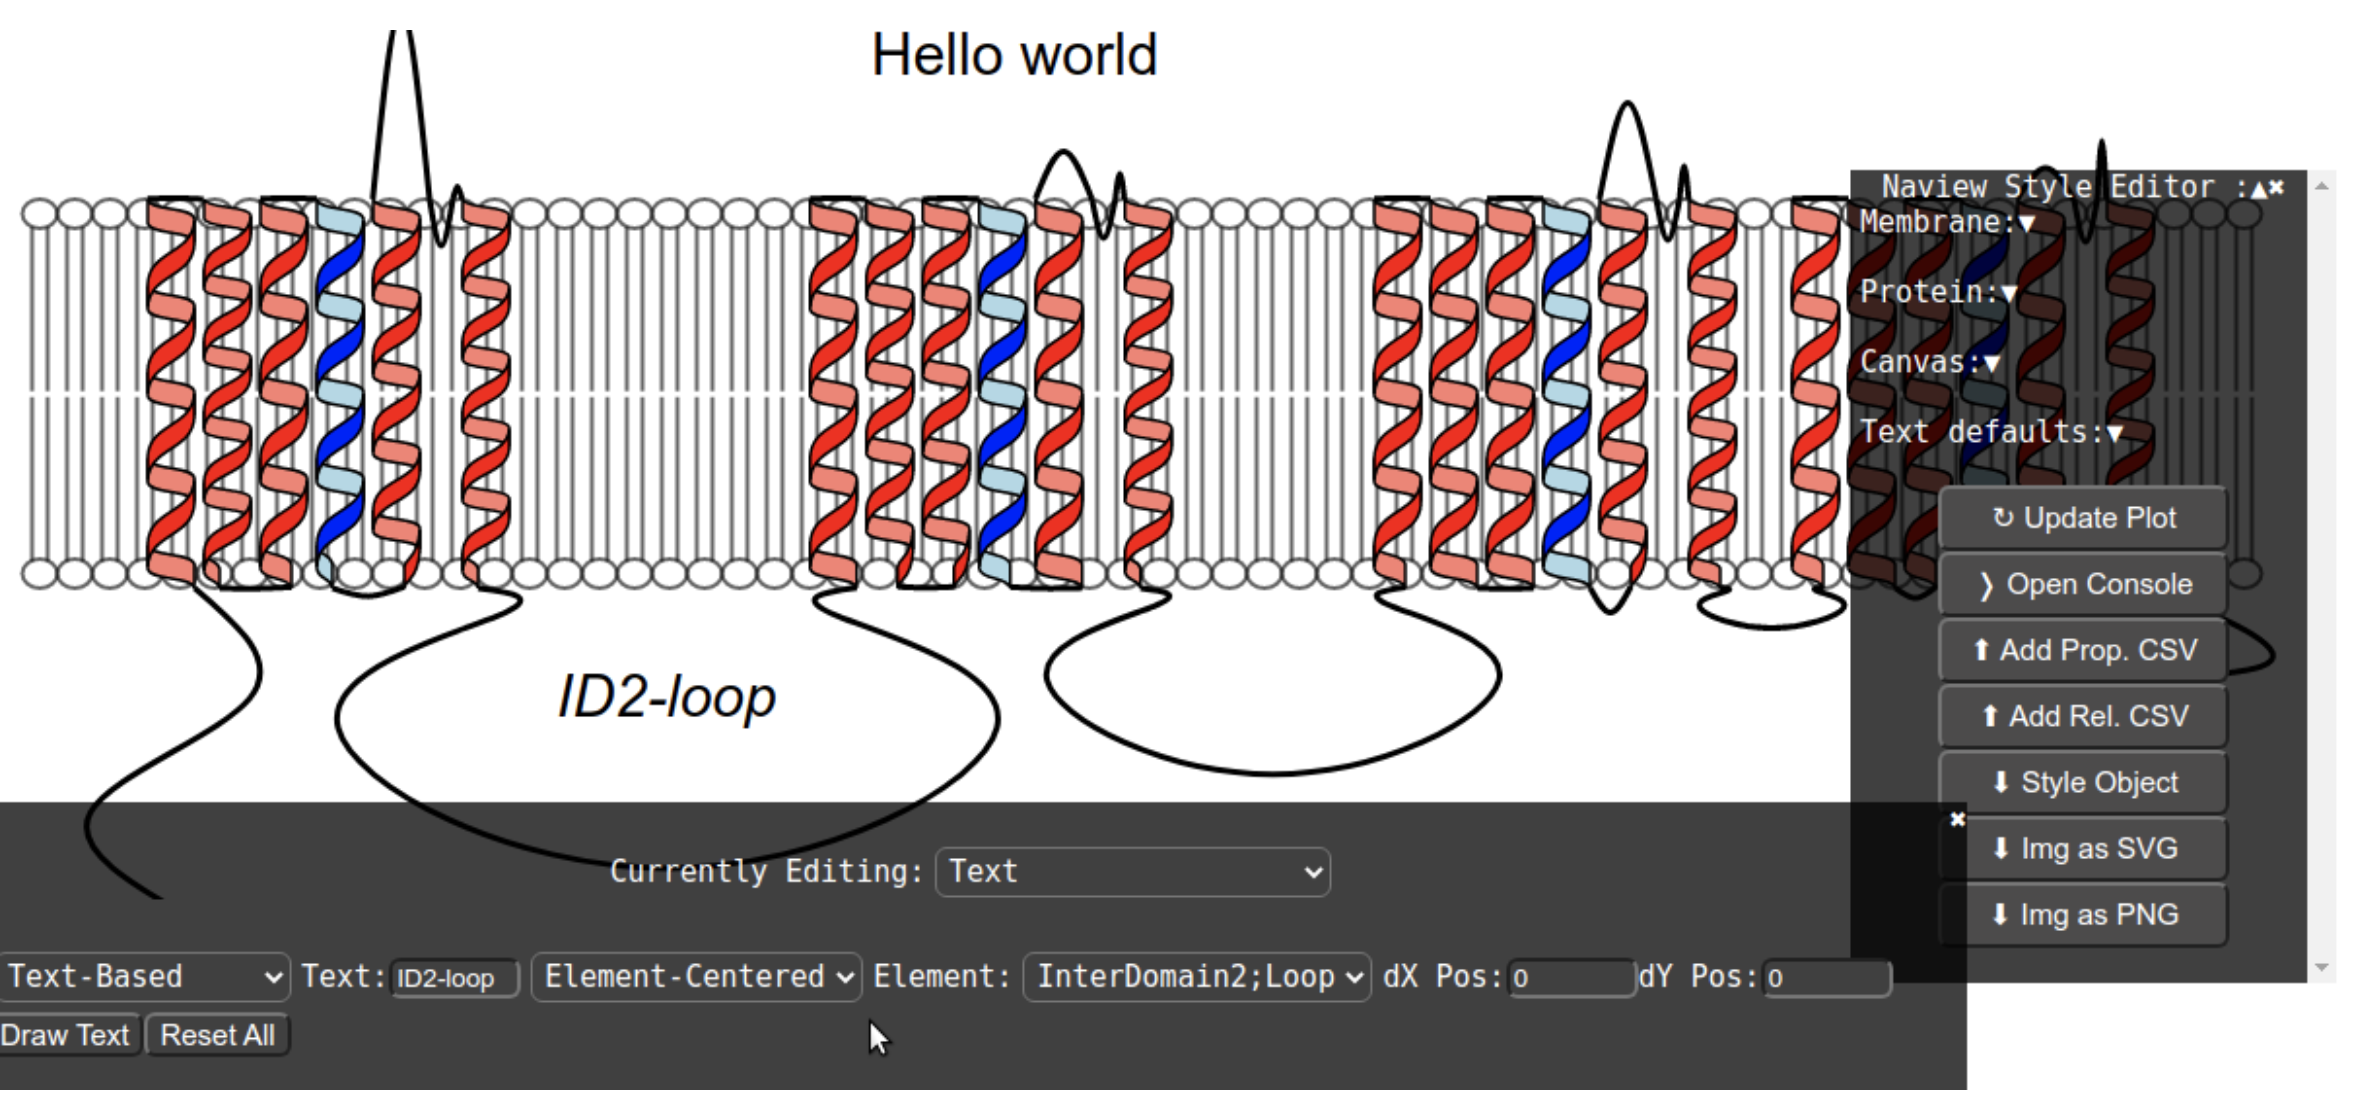
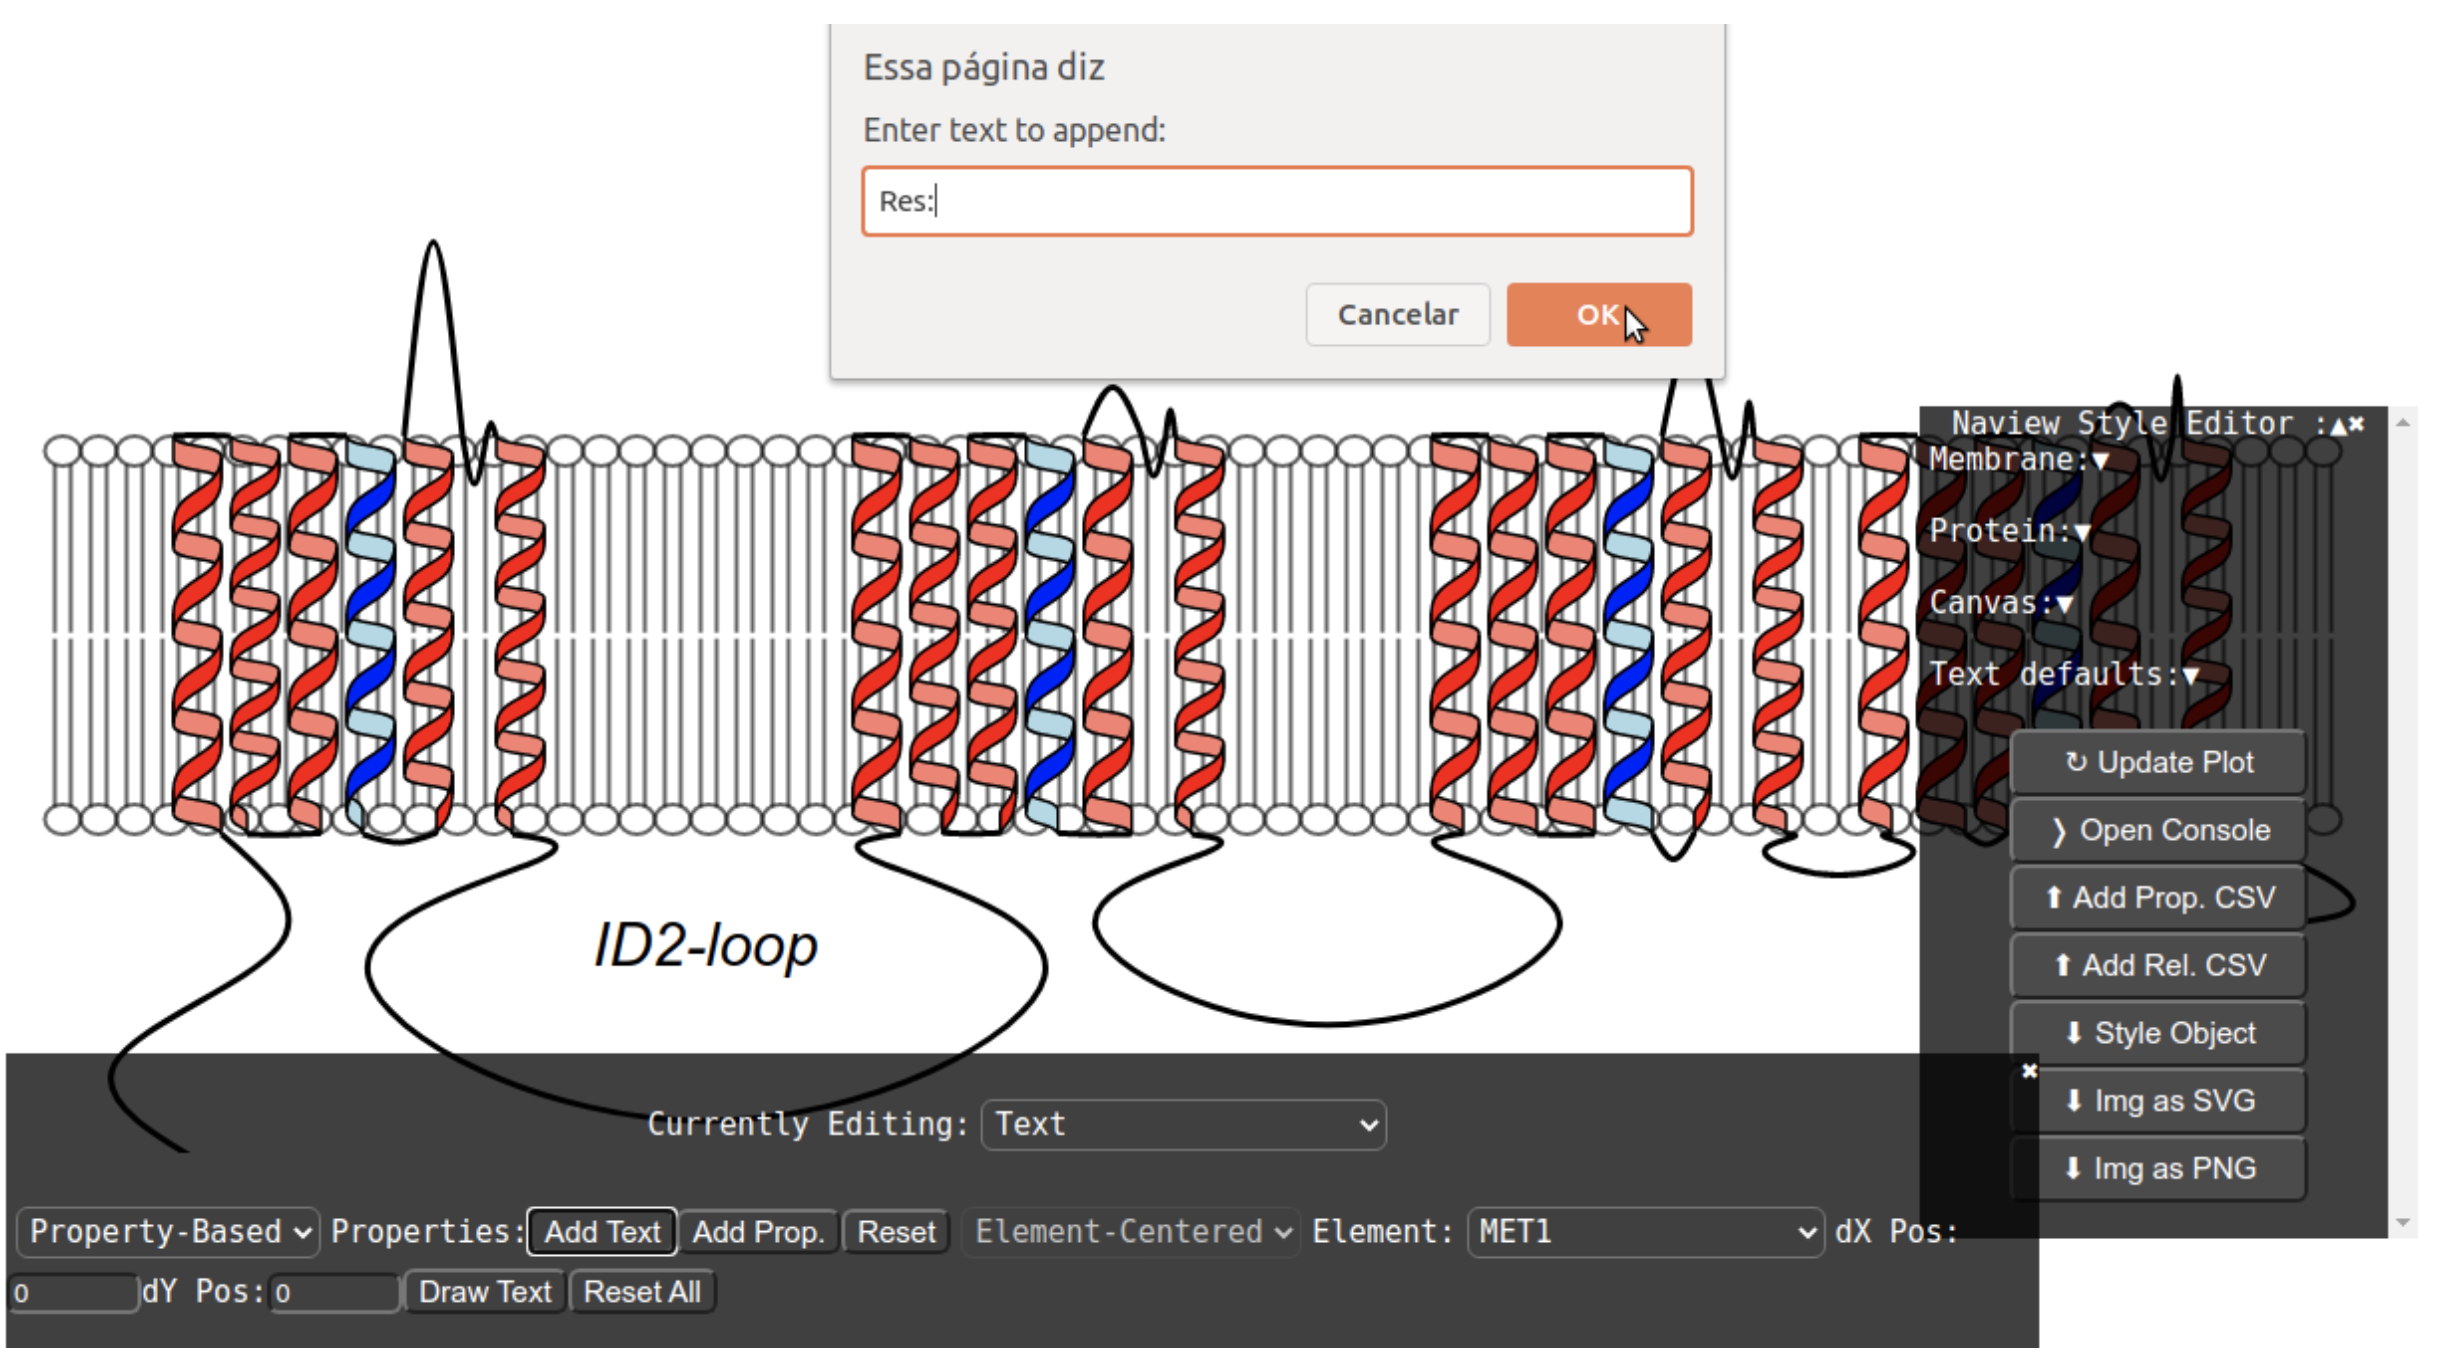
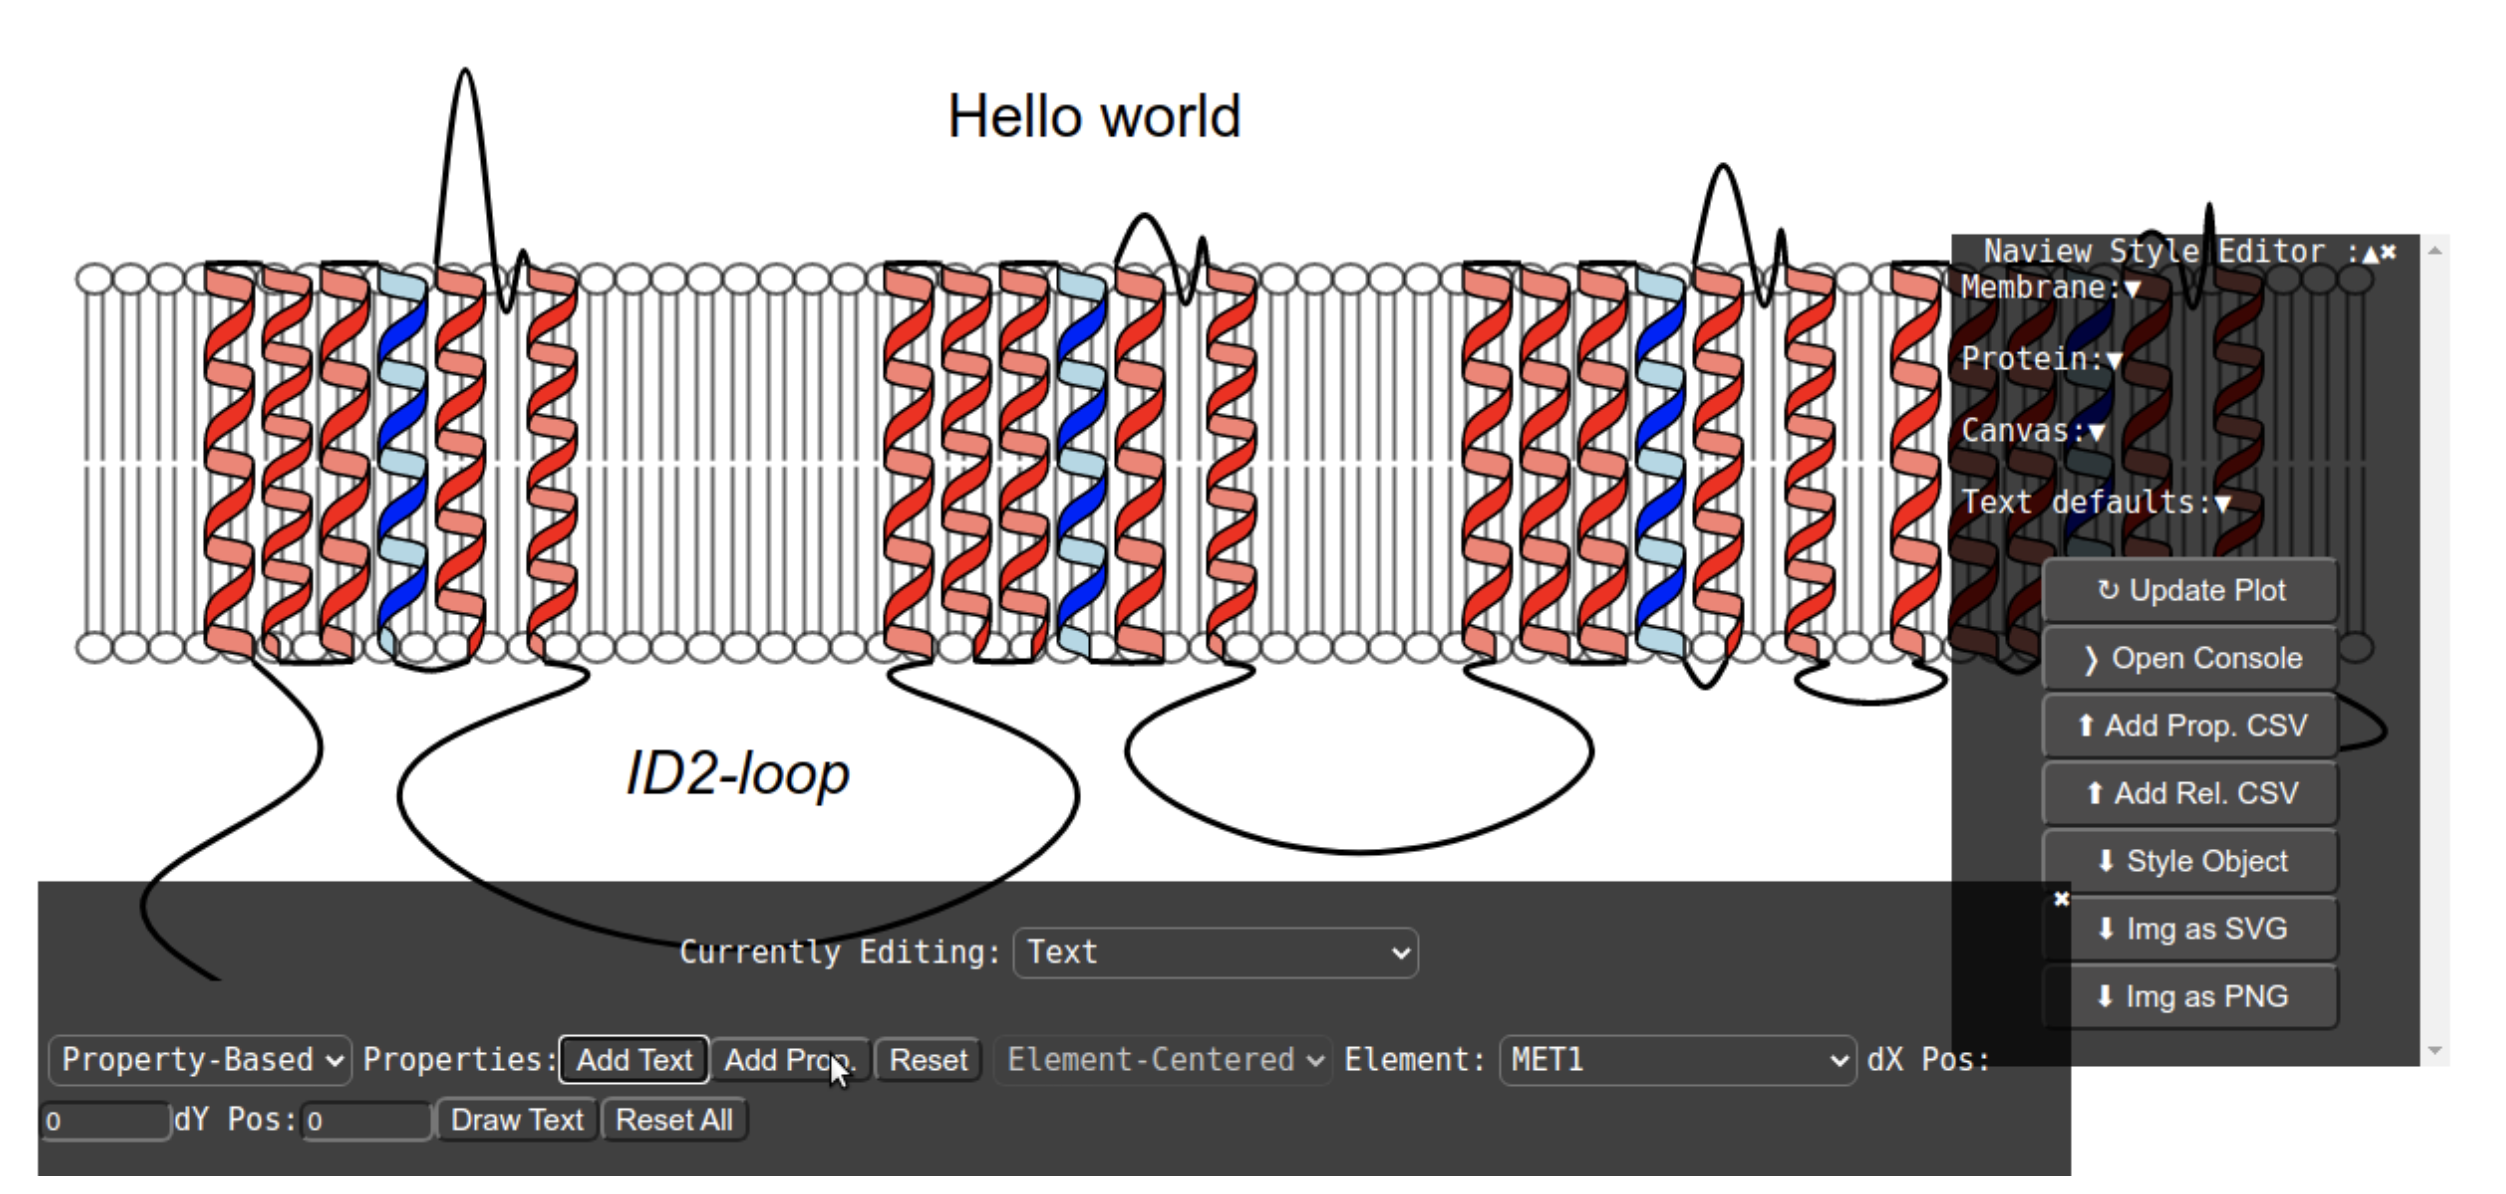
Text Annotations
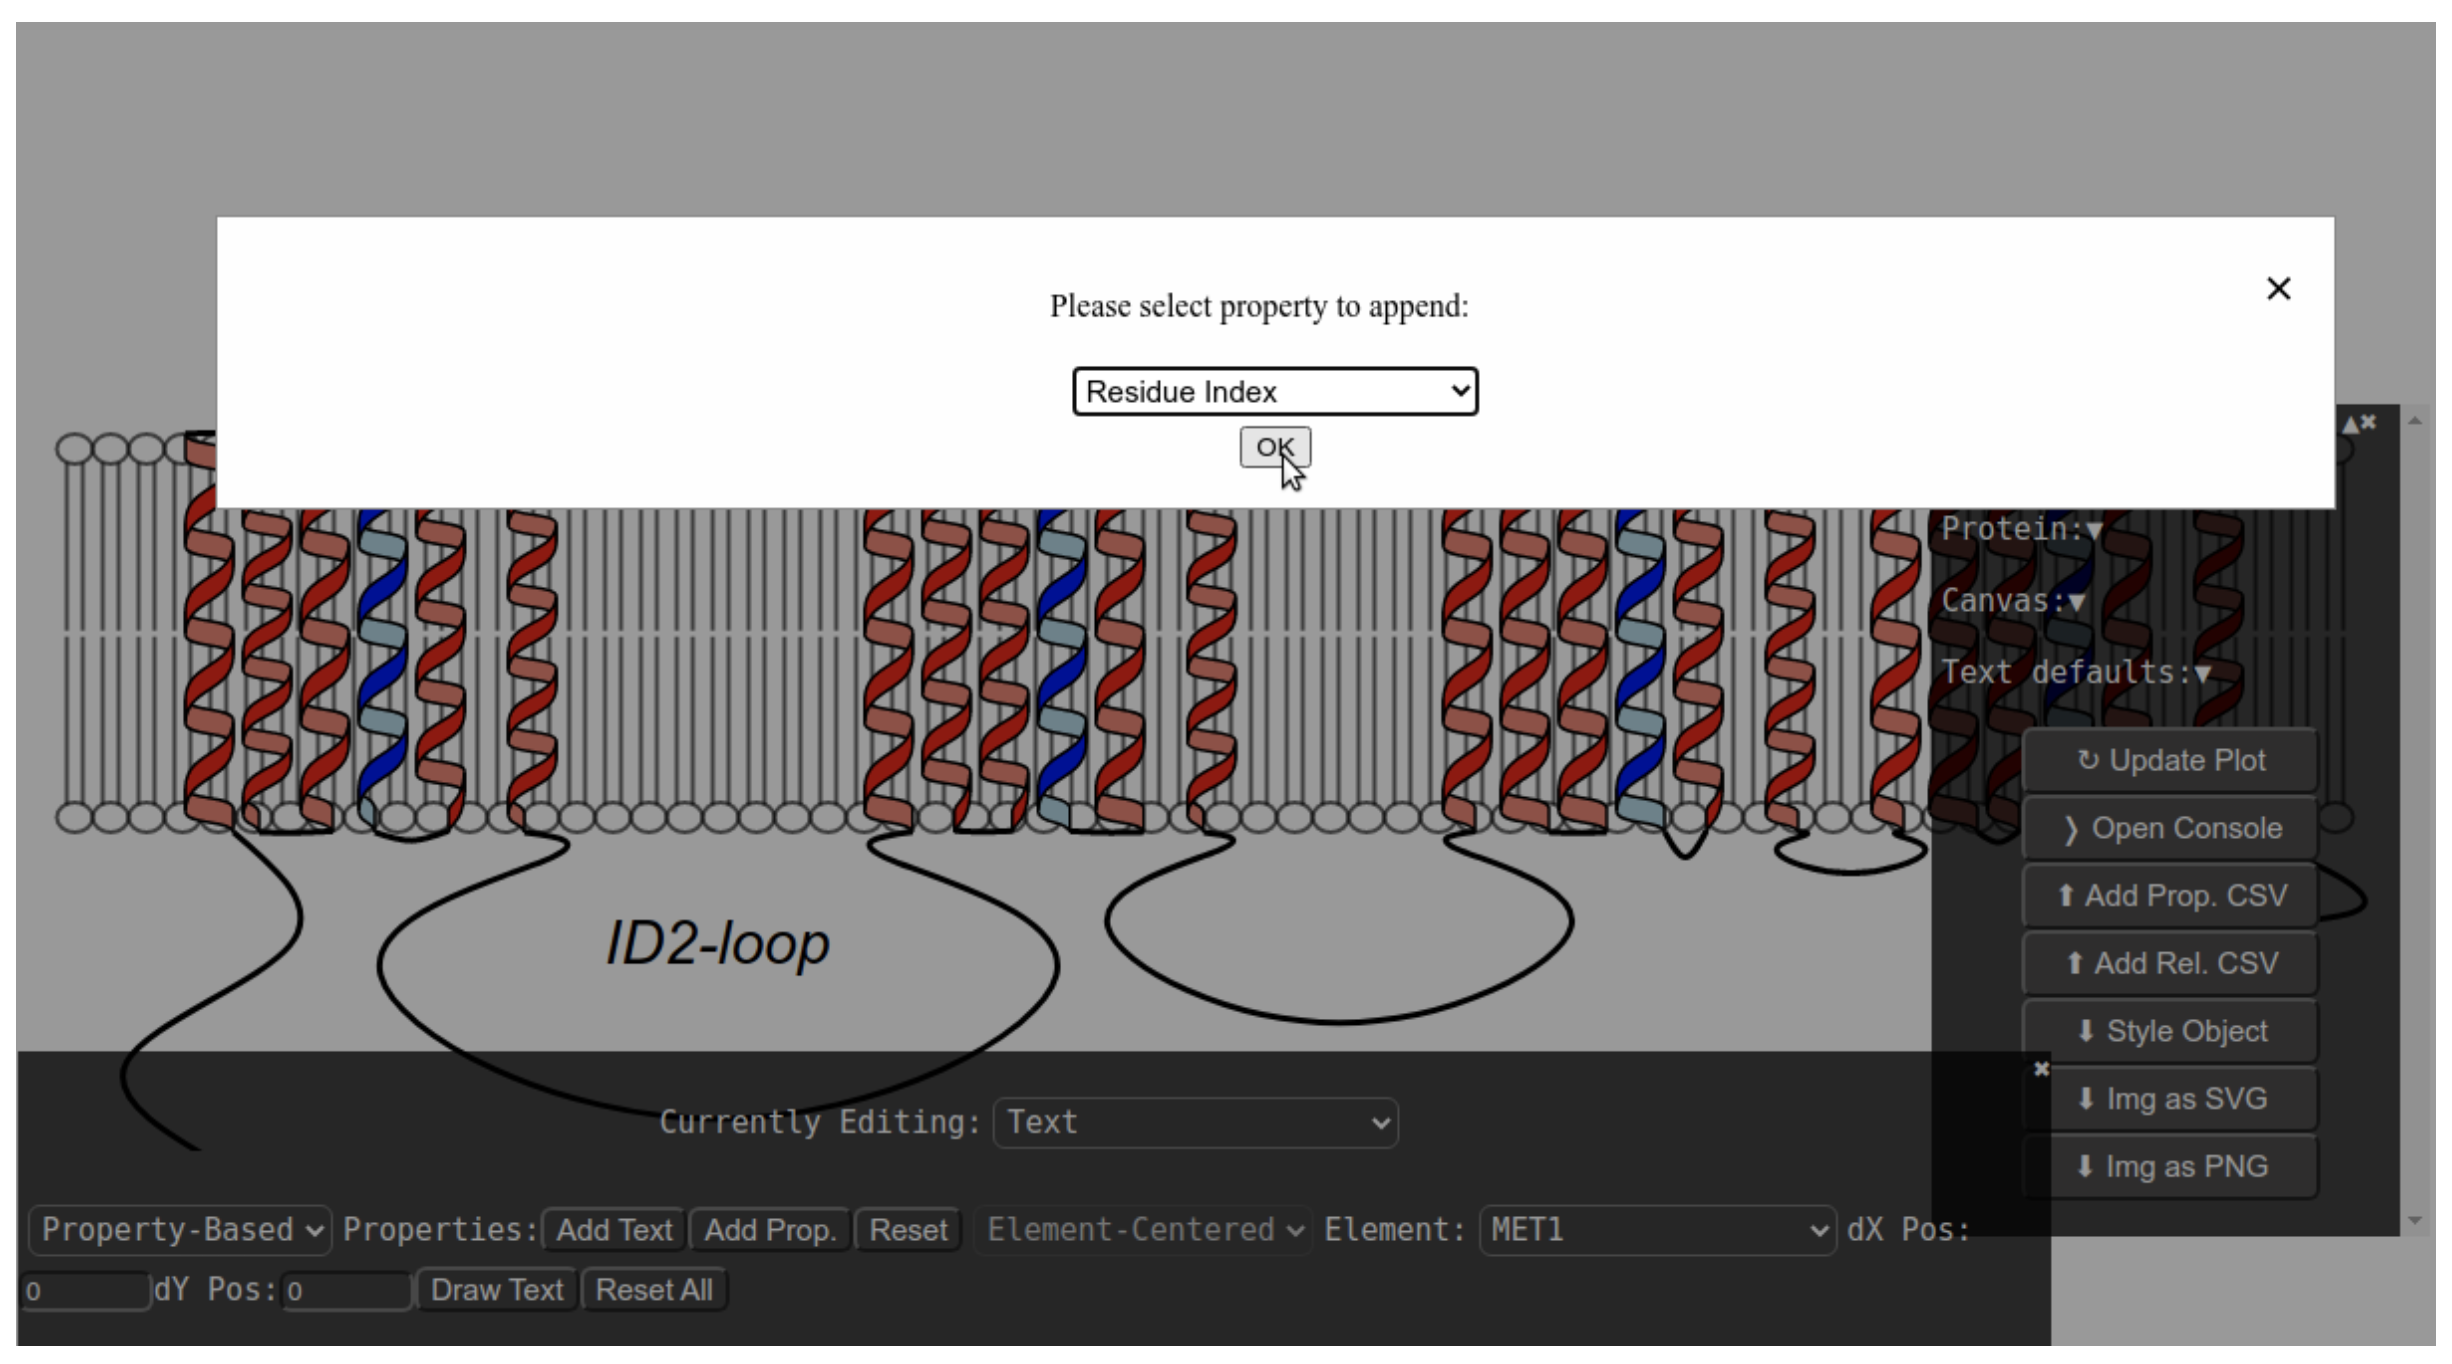
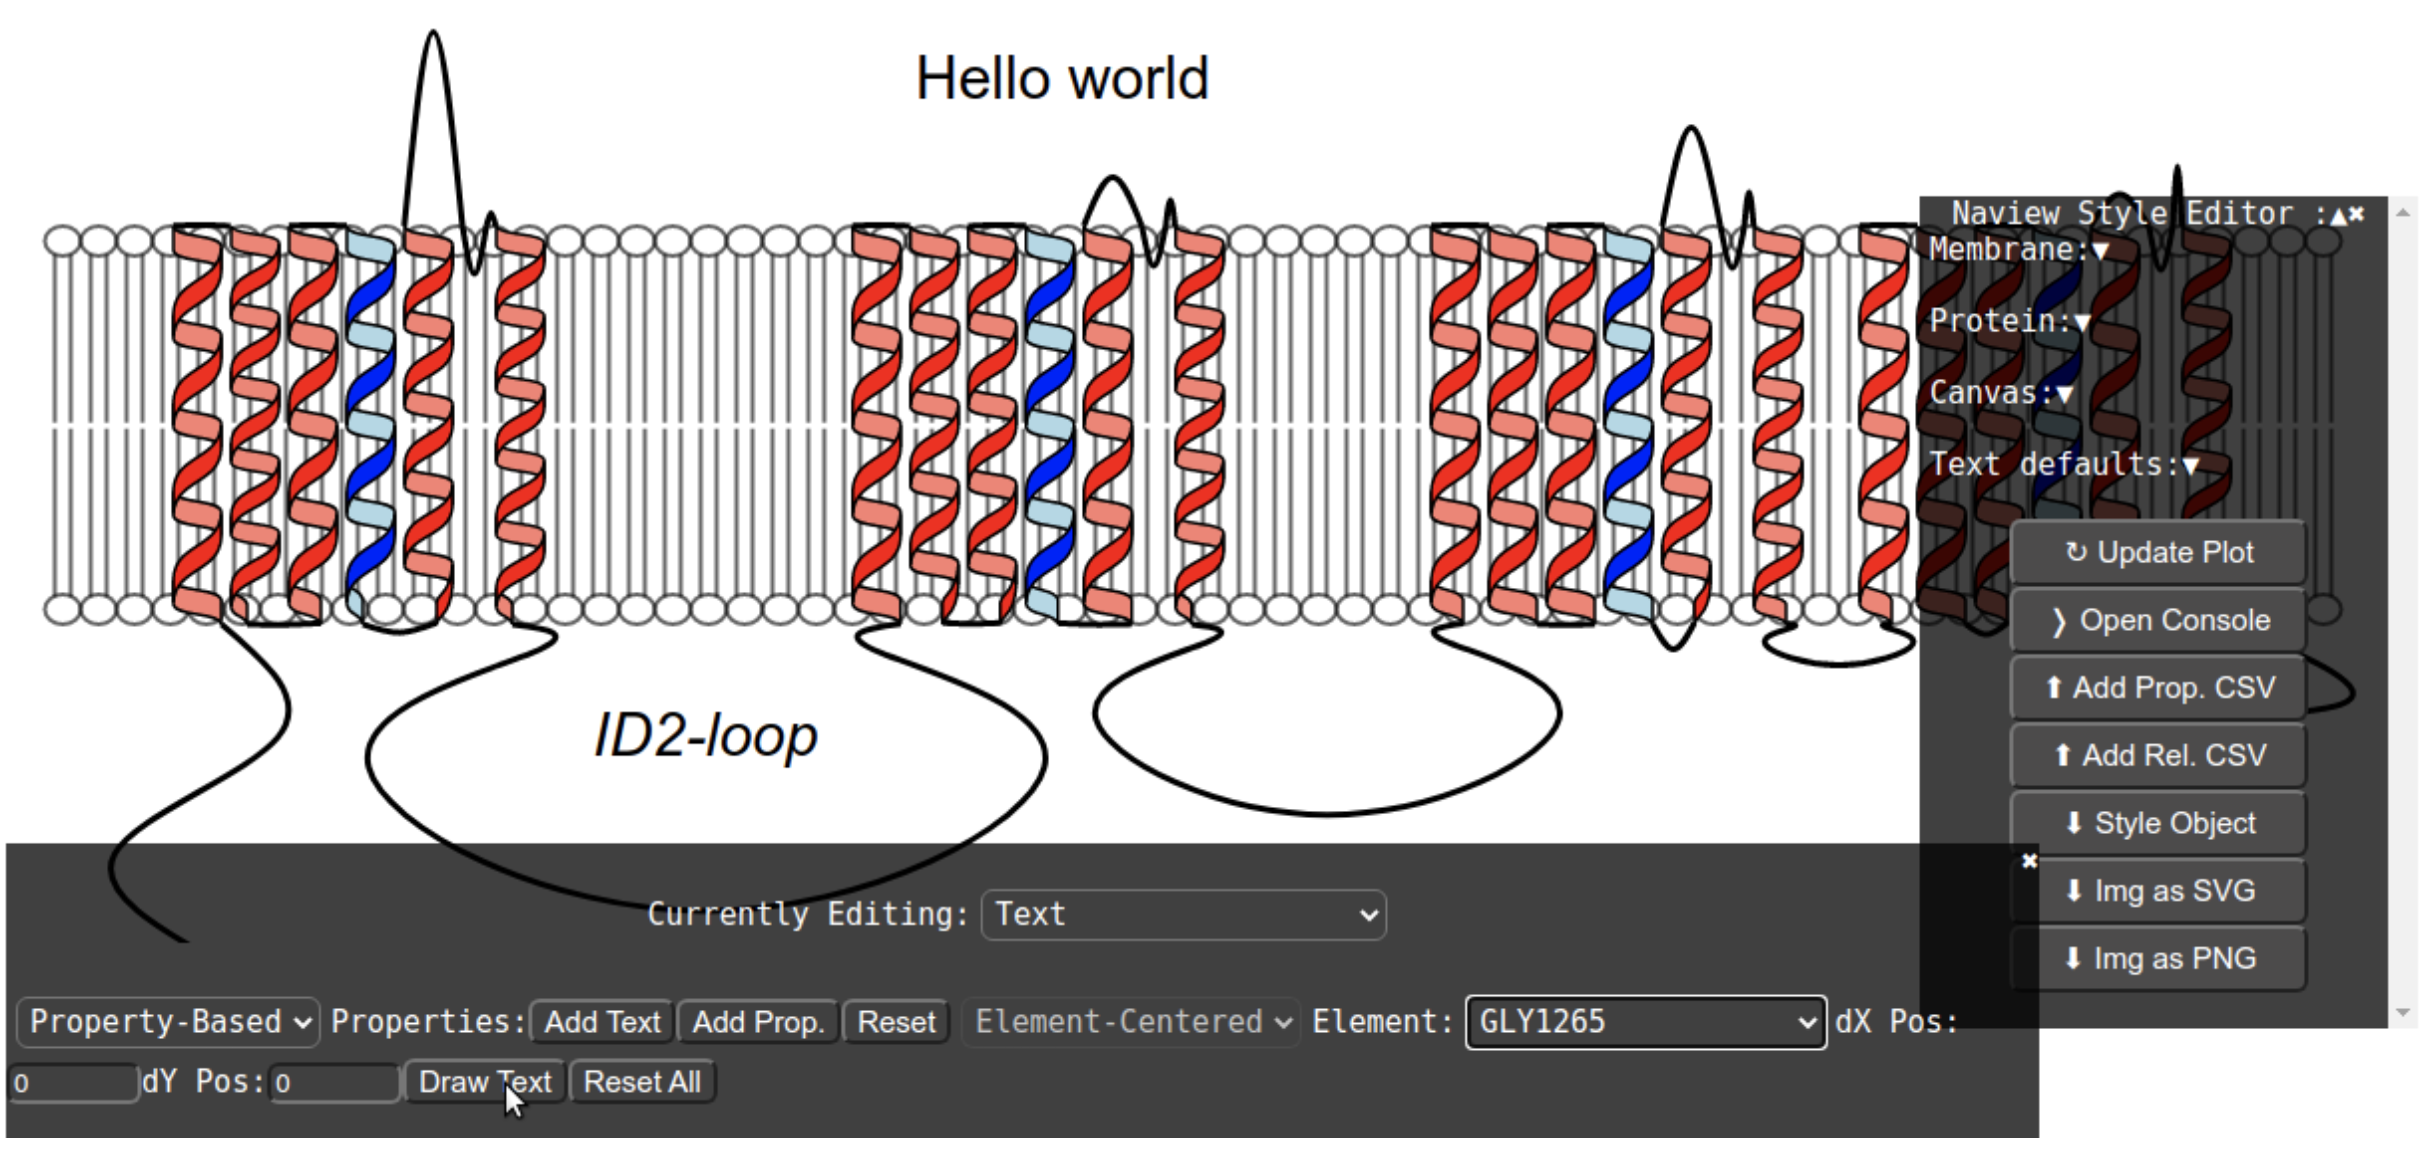
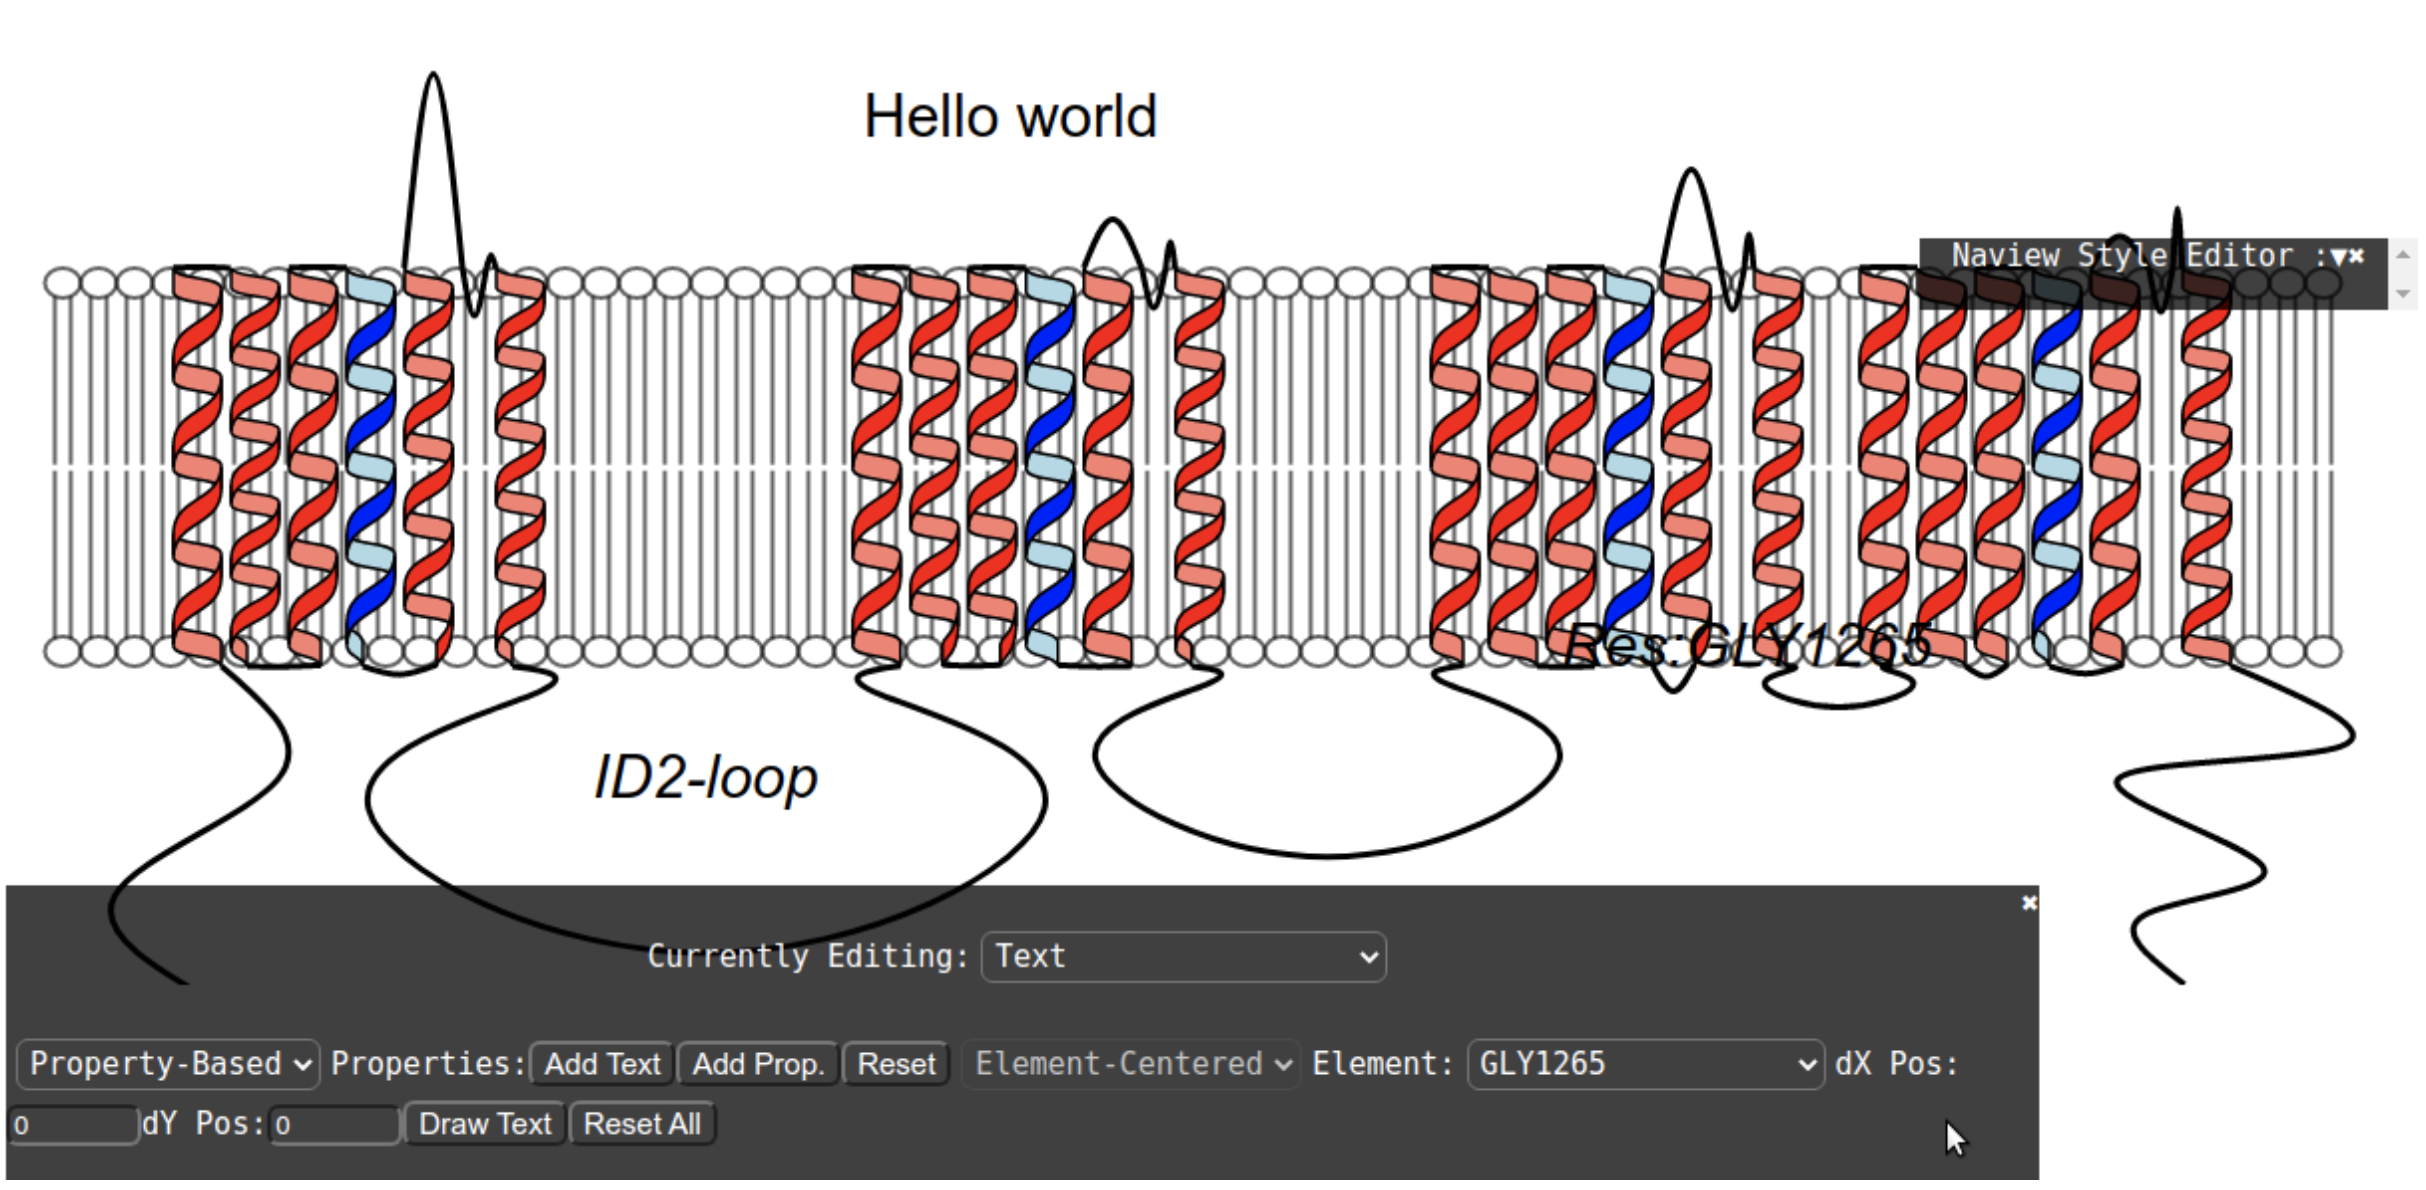
Text annotations can be included directly in the NaView rendering object as a list of json objects as shown in the example below:
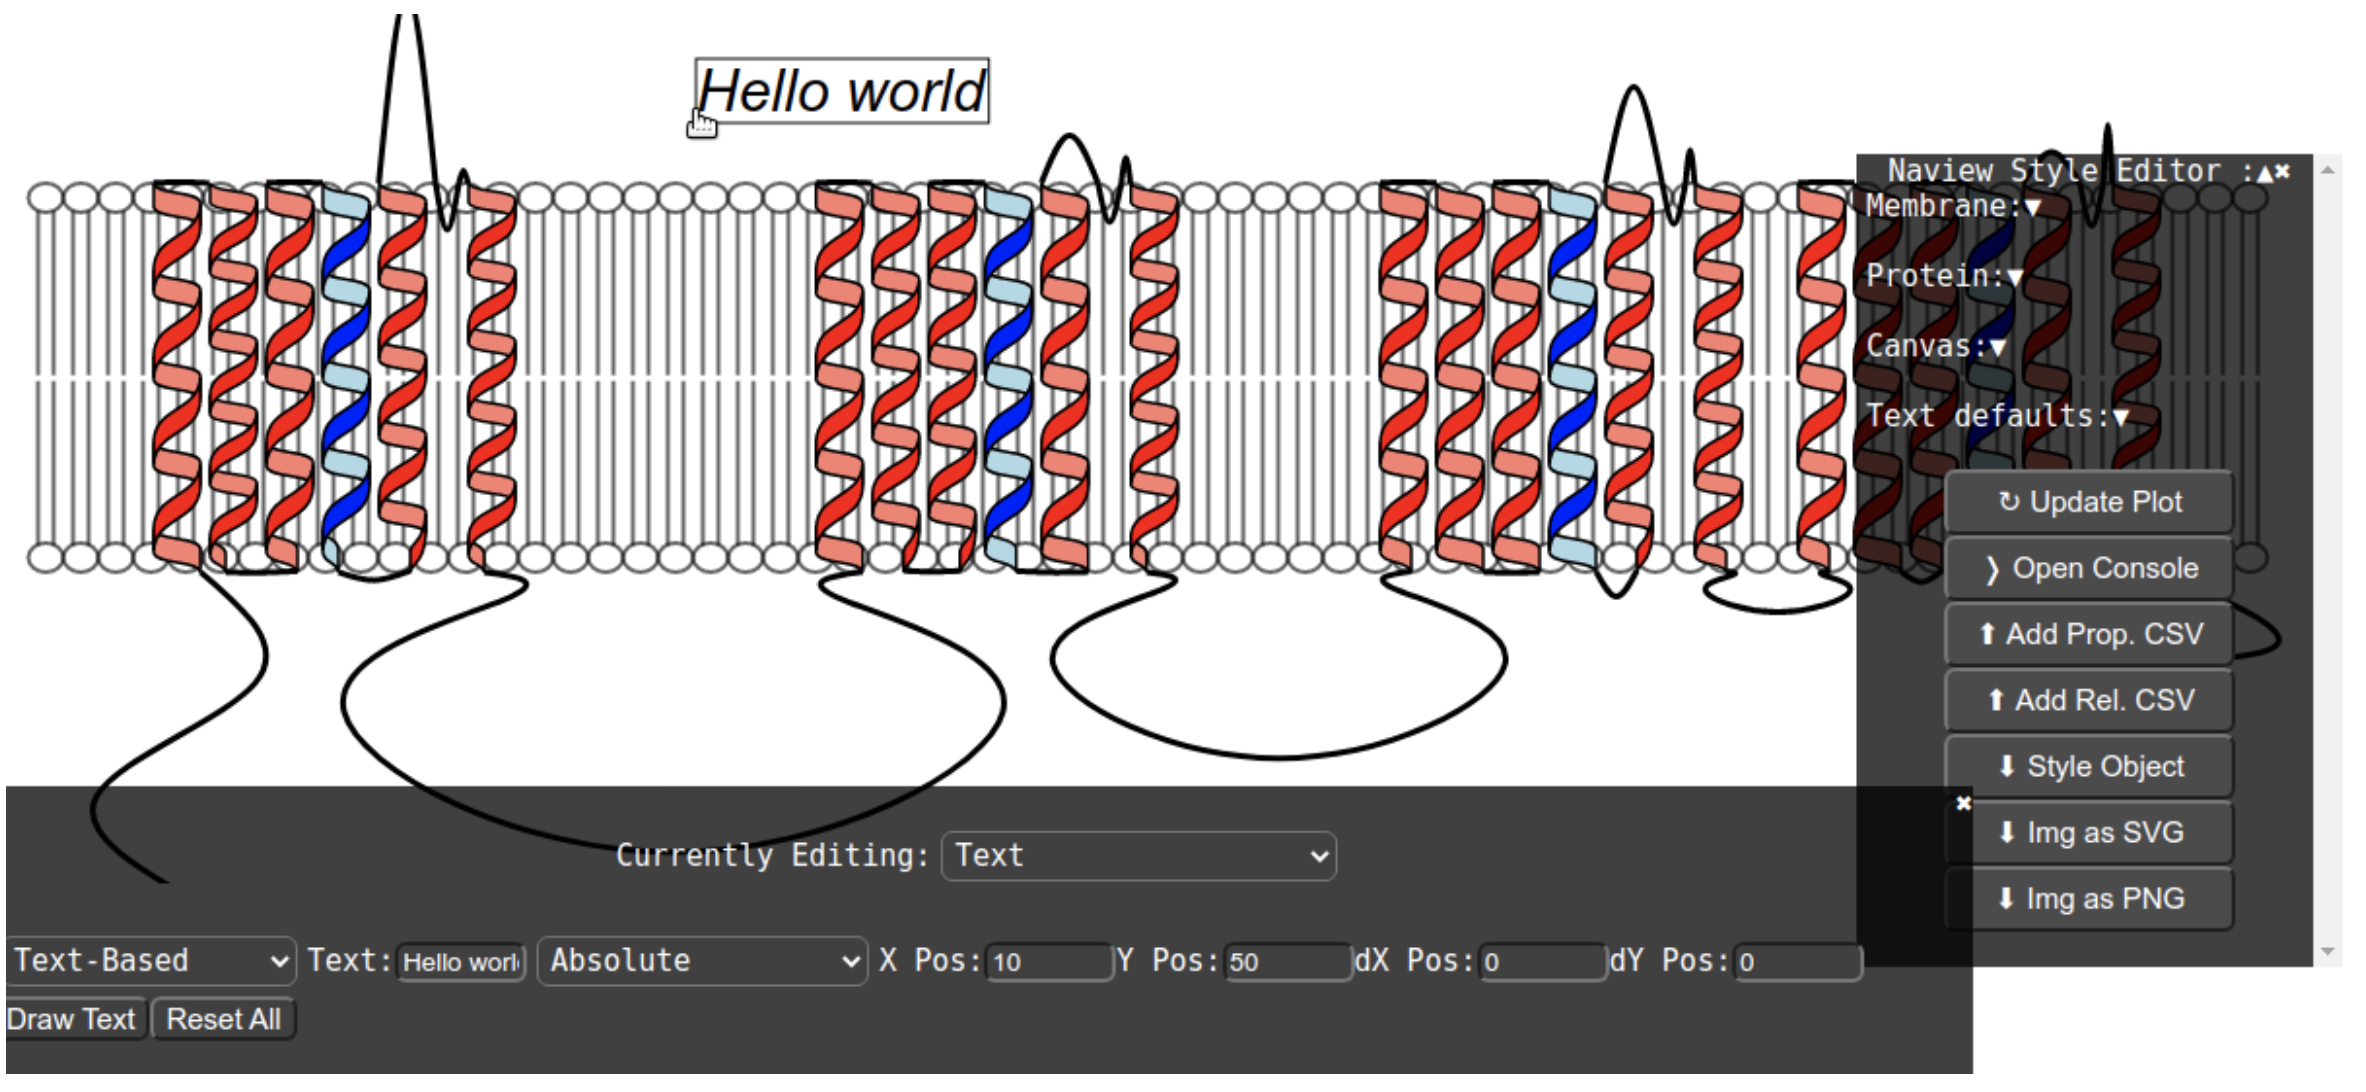
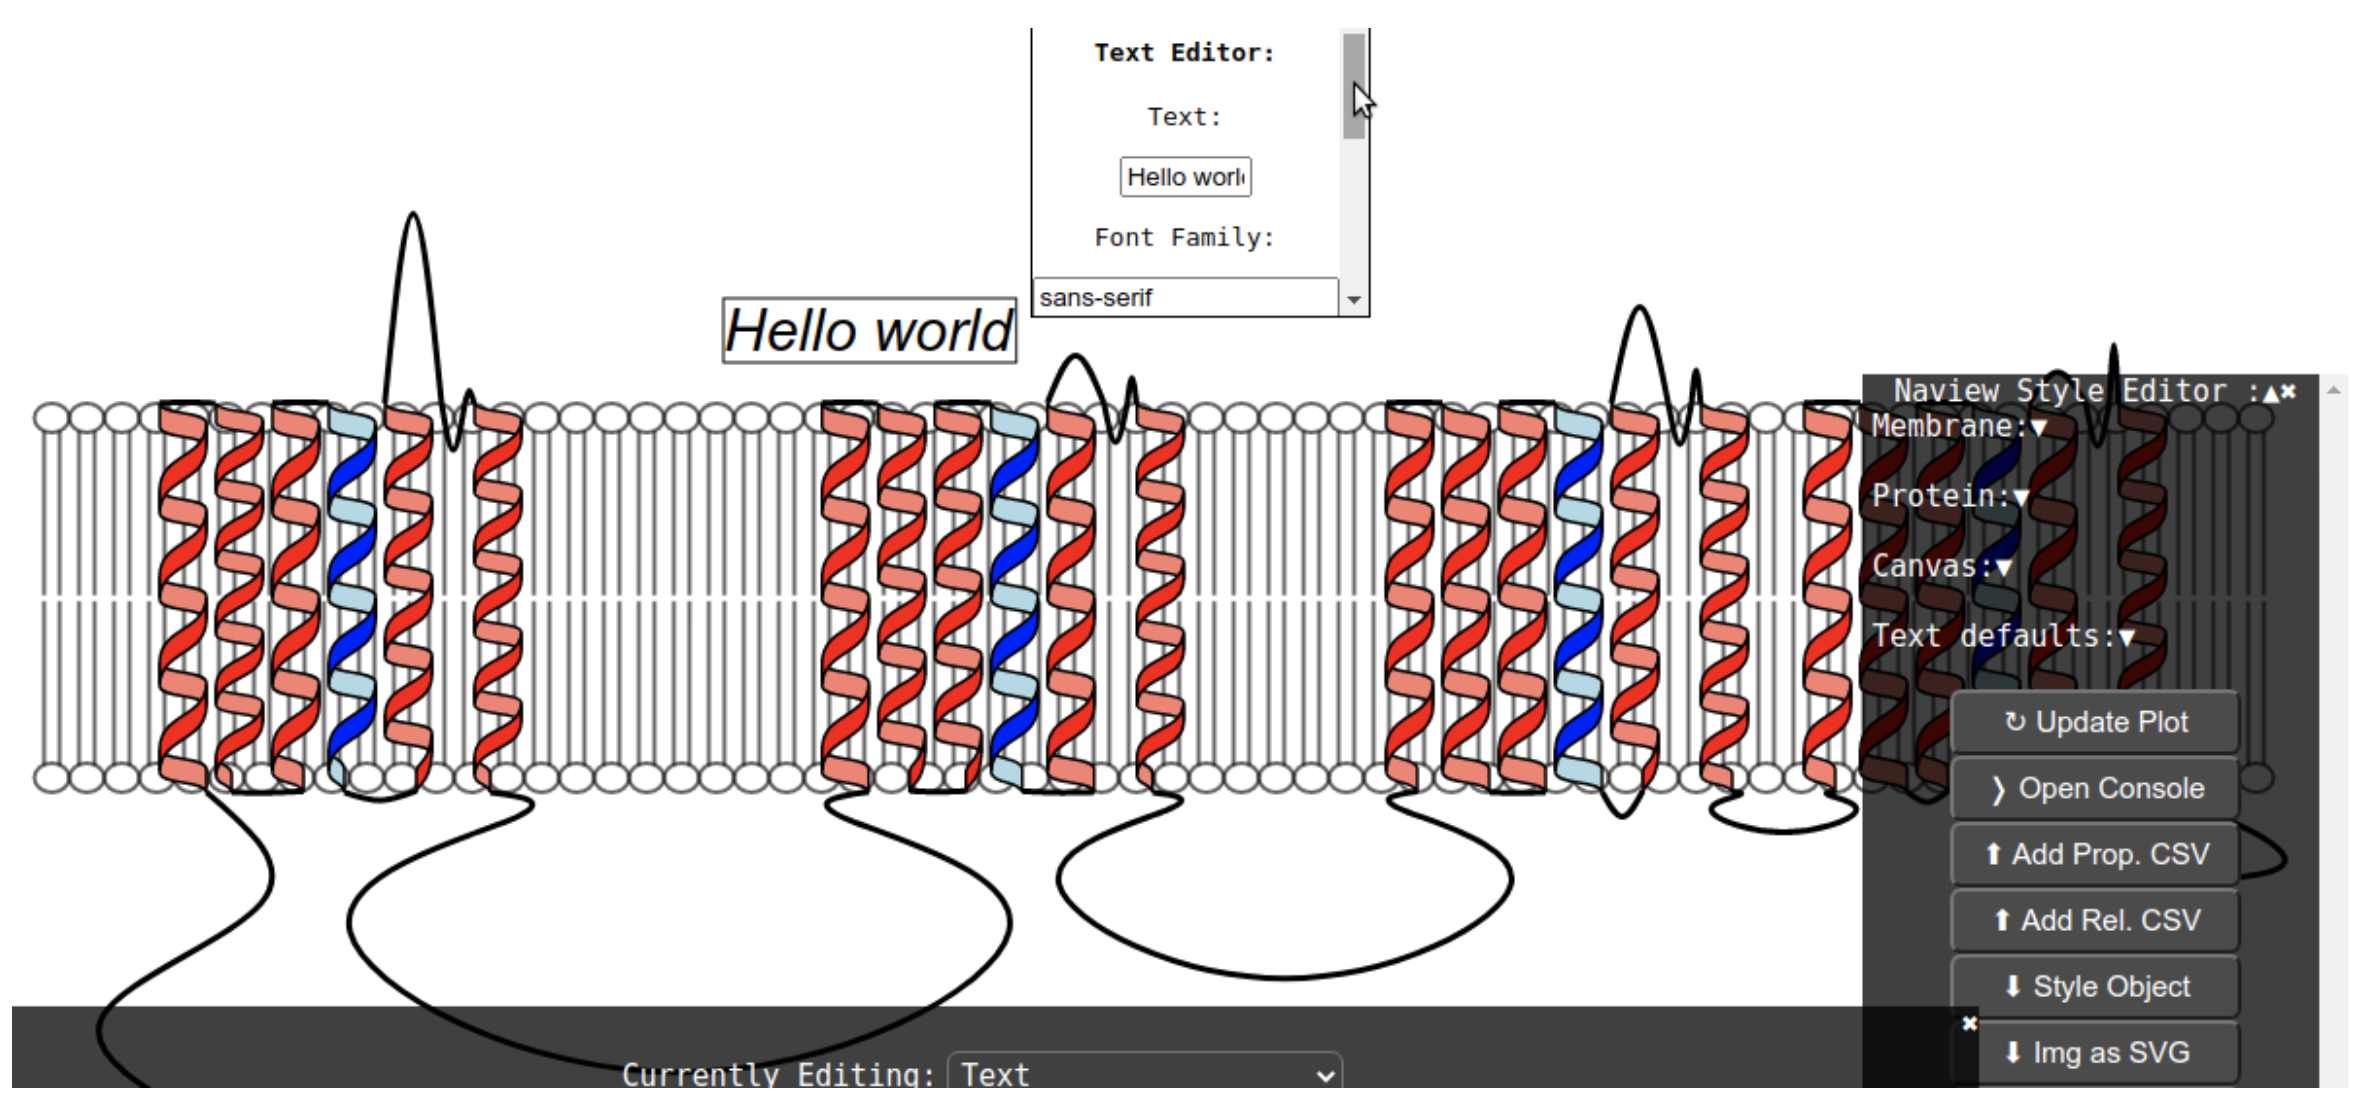
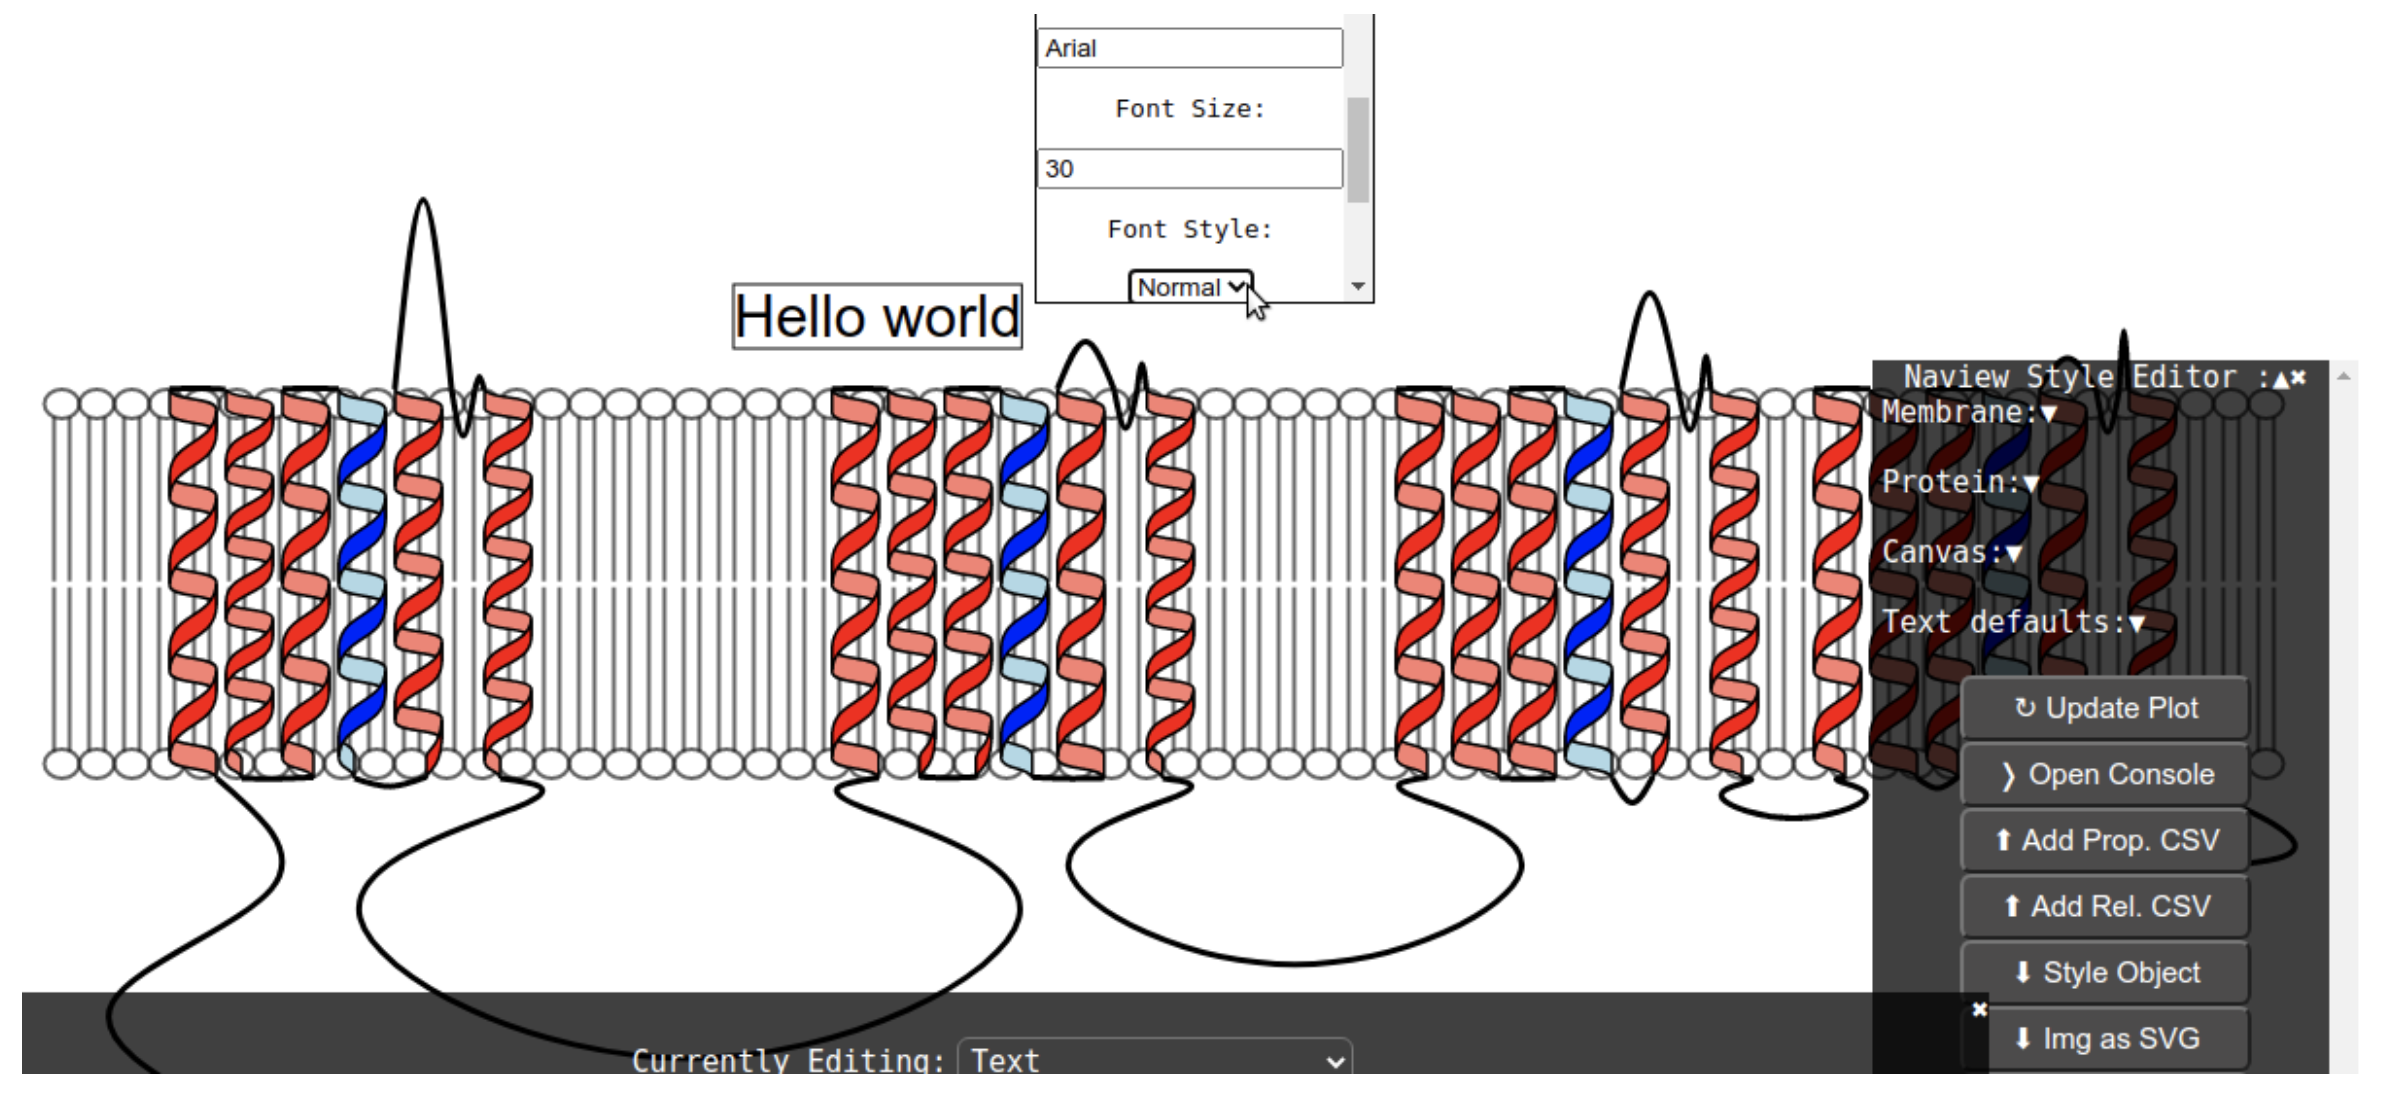
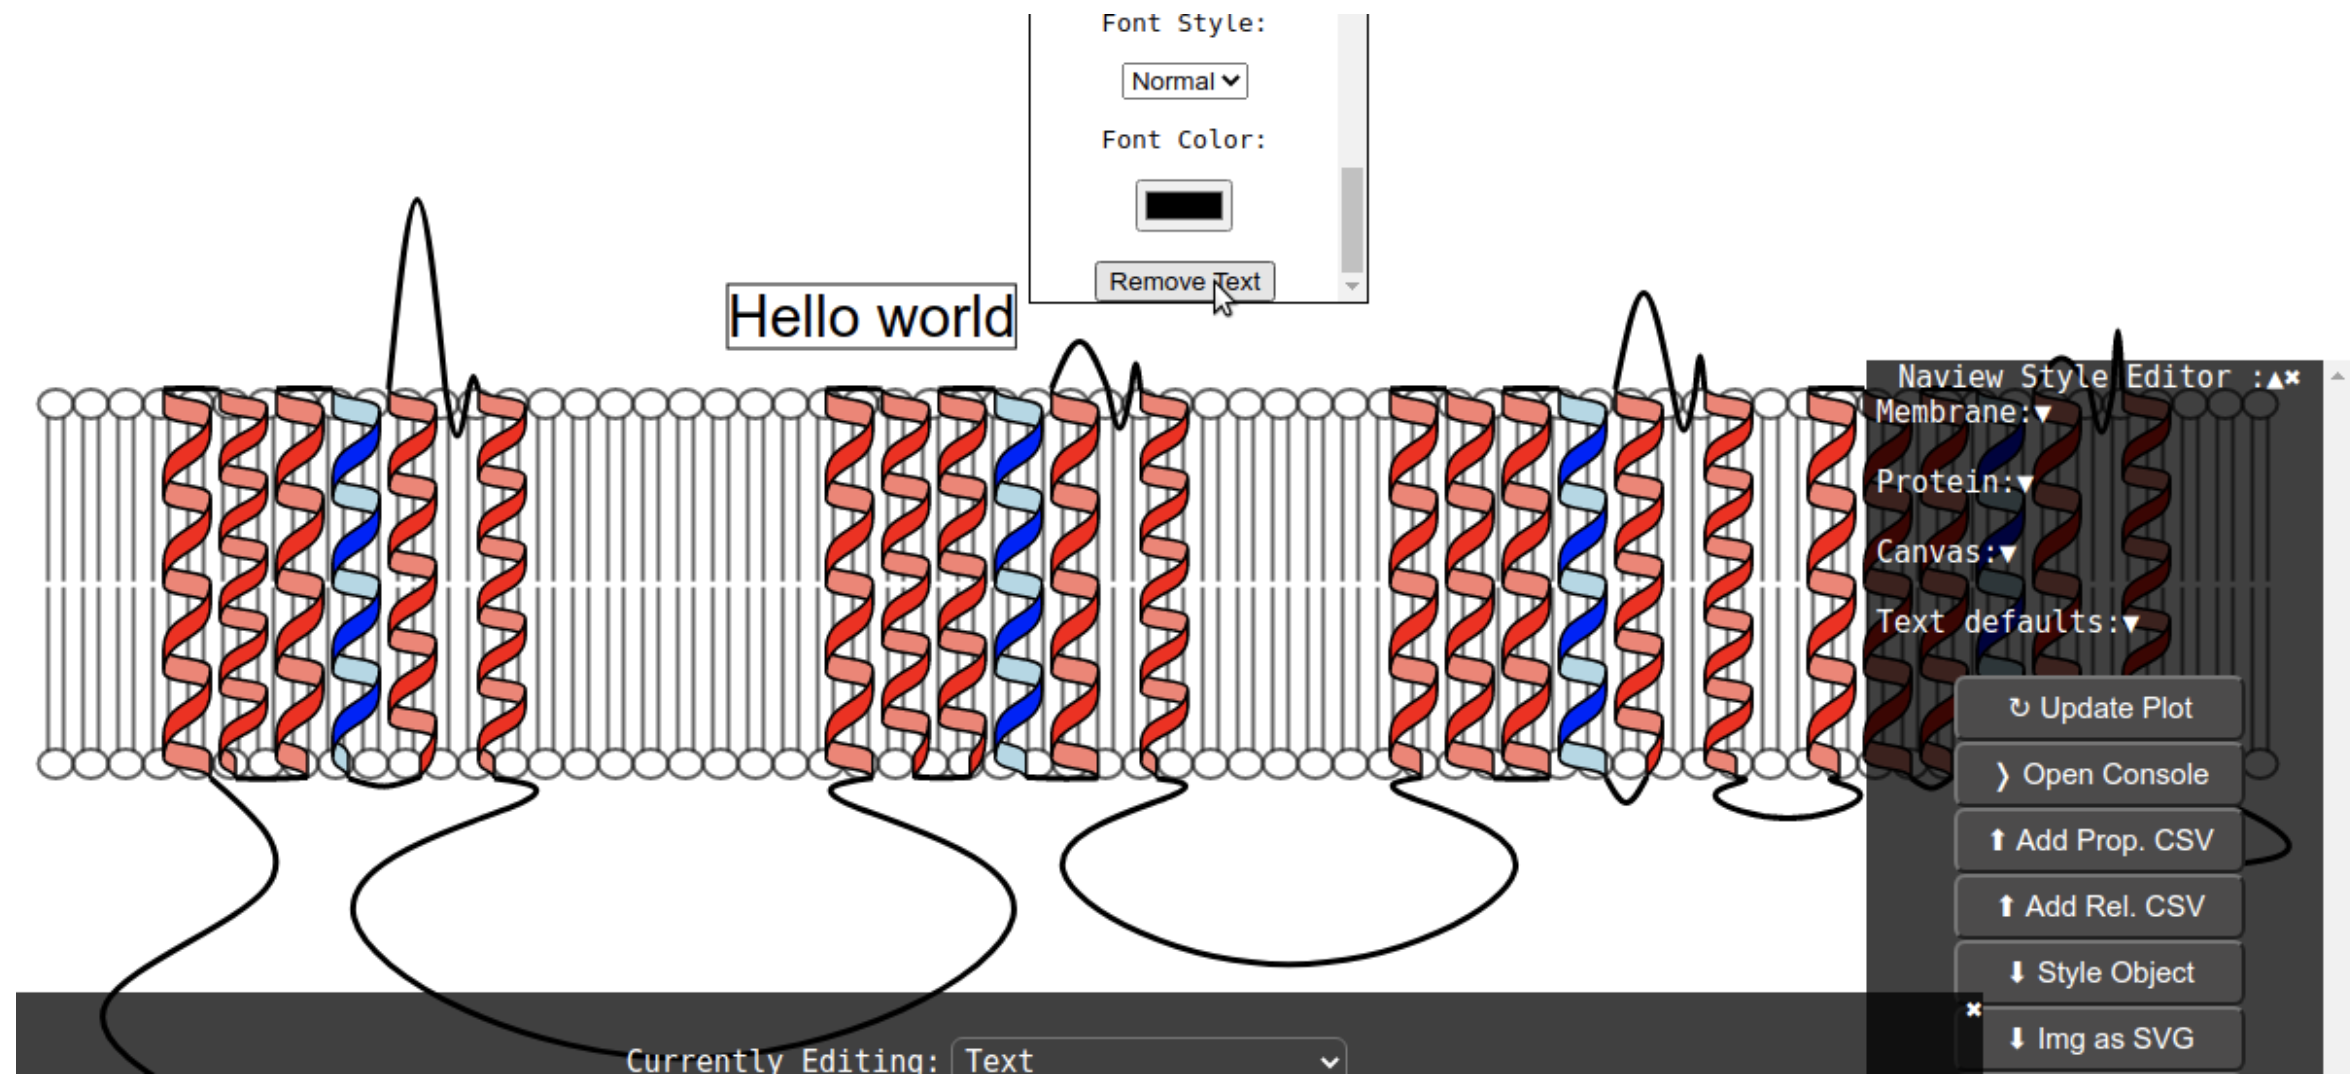
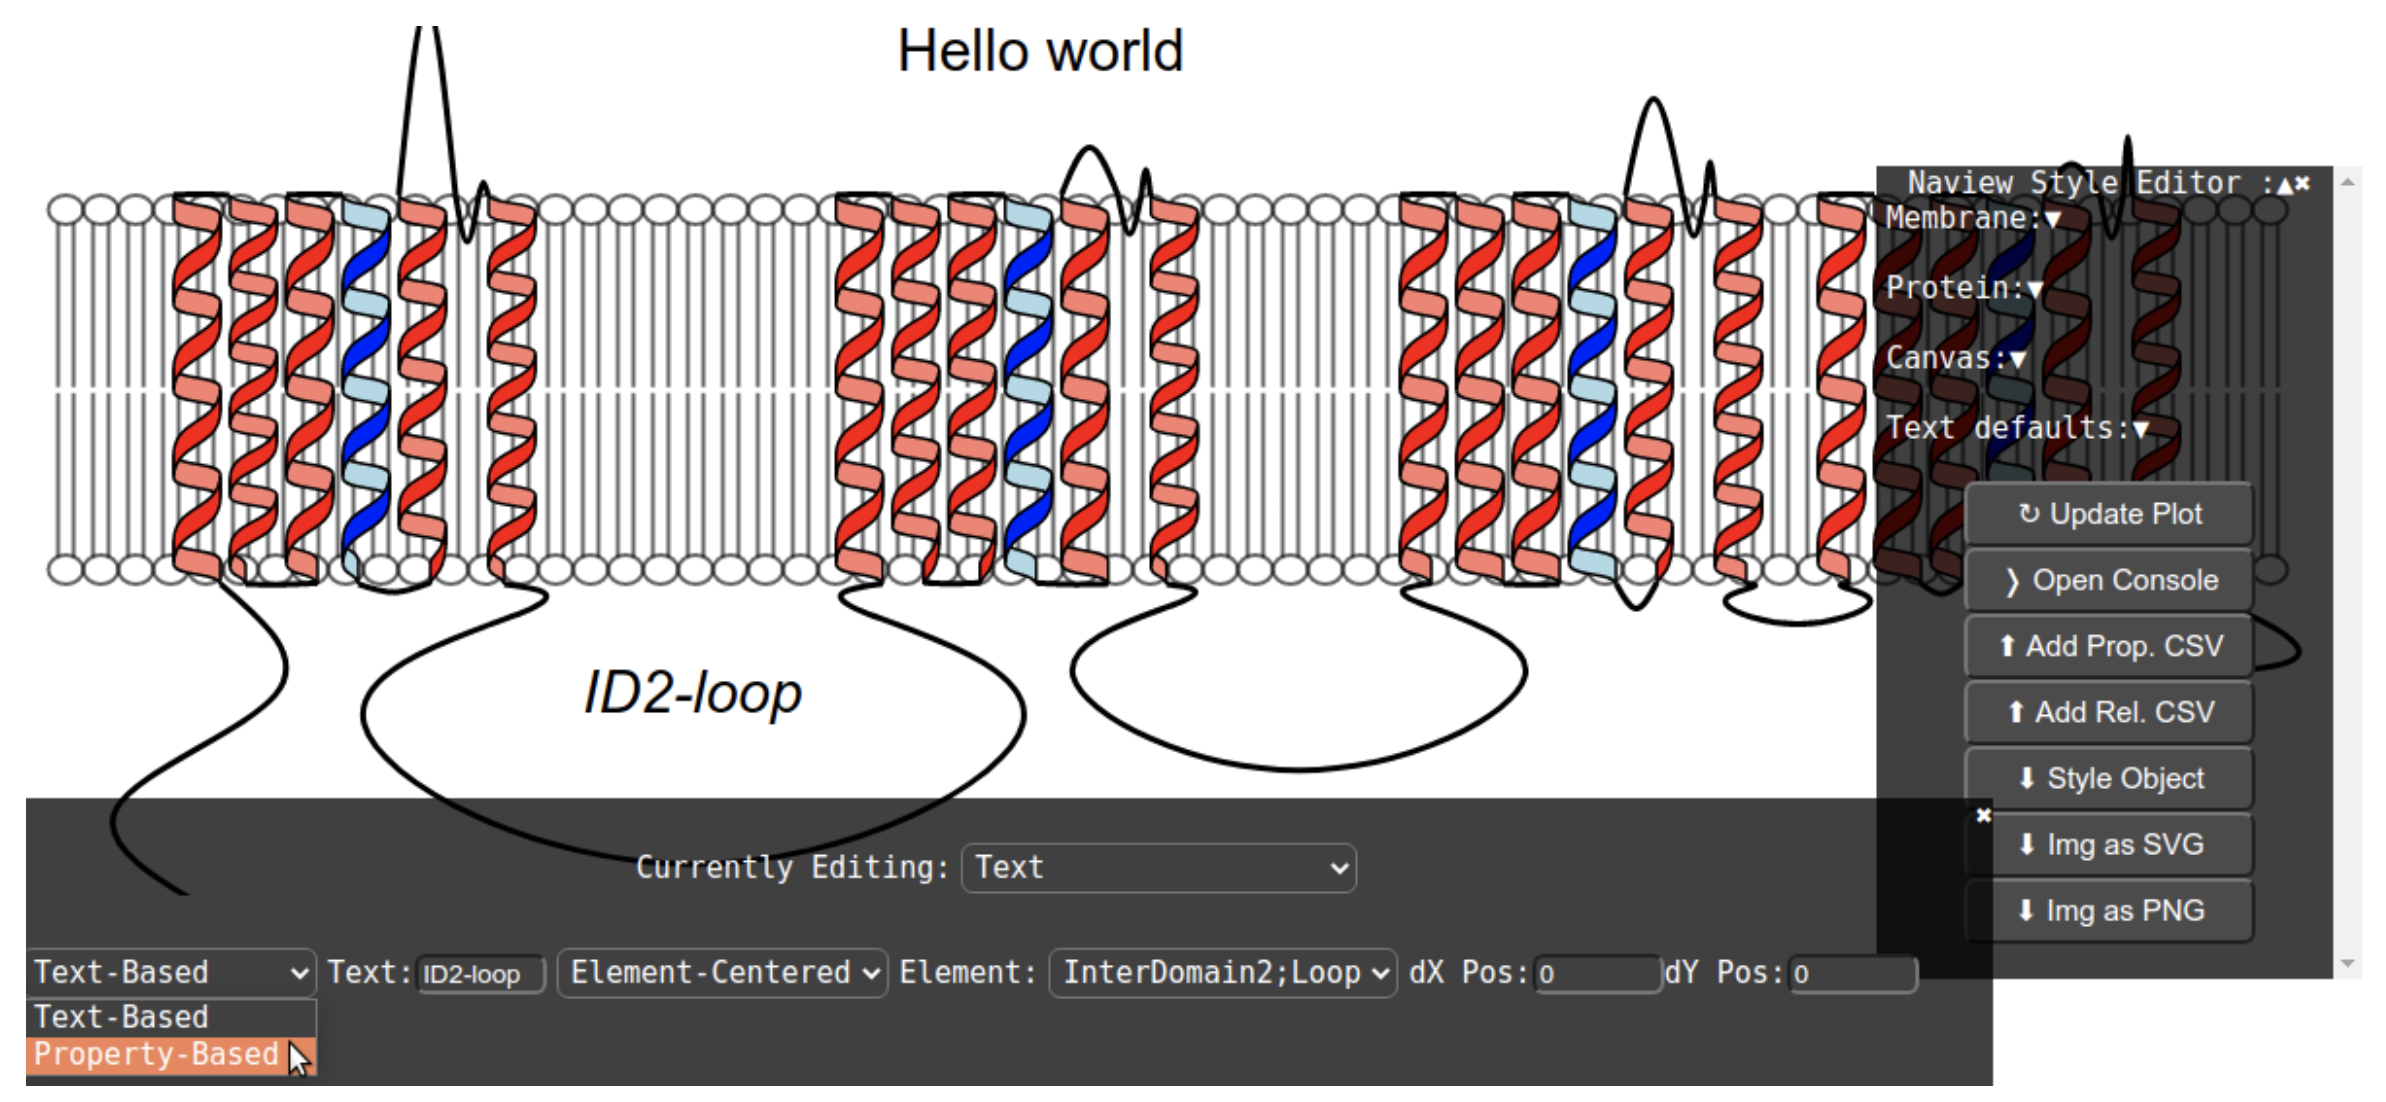
Alternatively, text annotations can be included by using the NaView Style Editor.
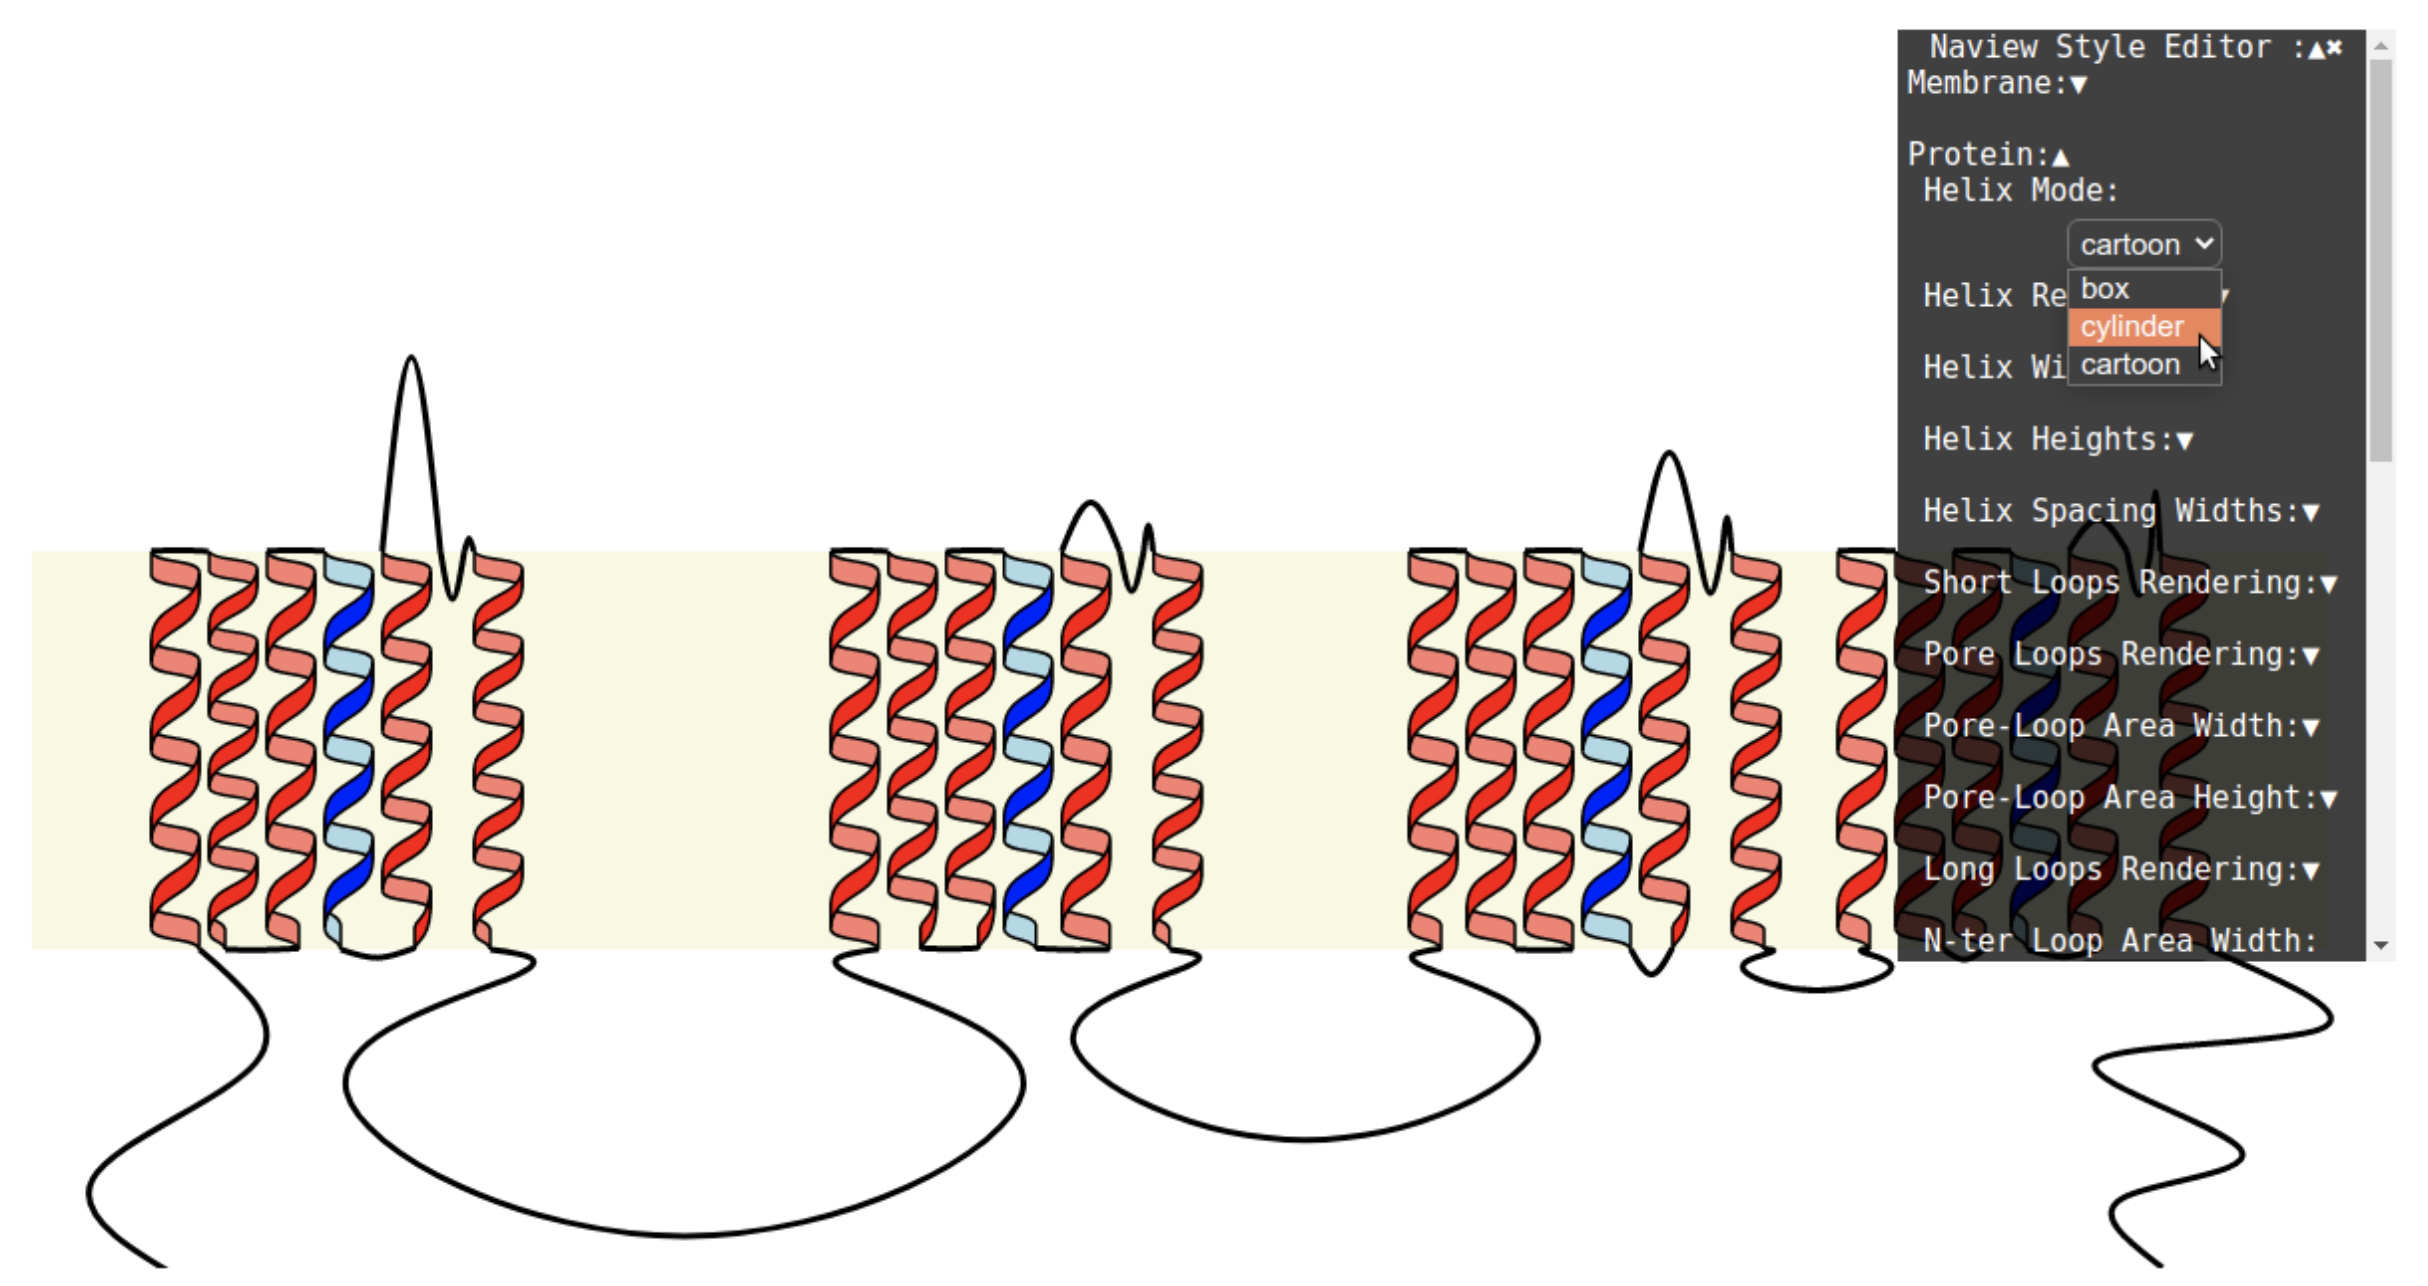
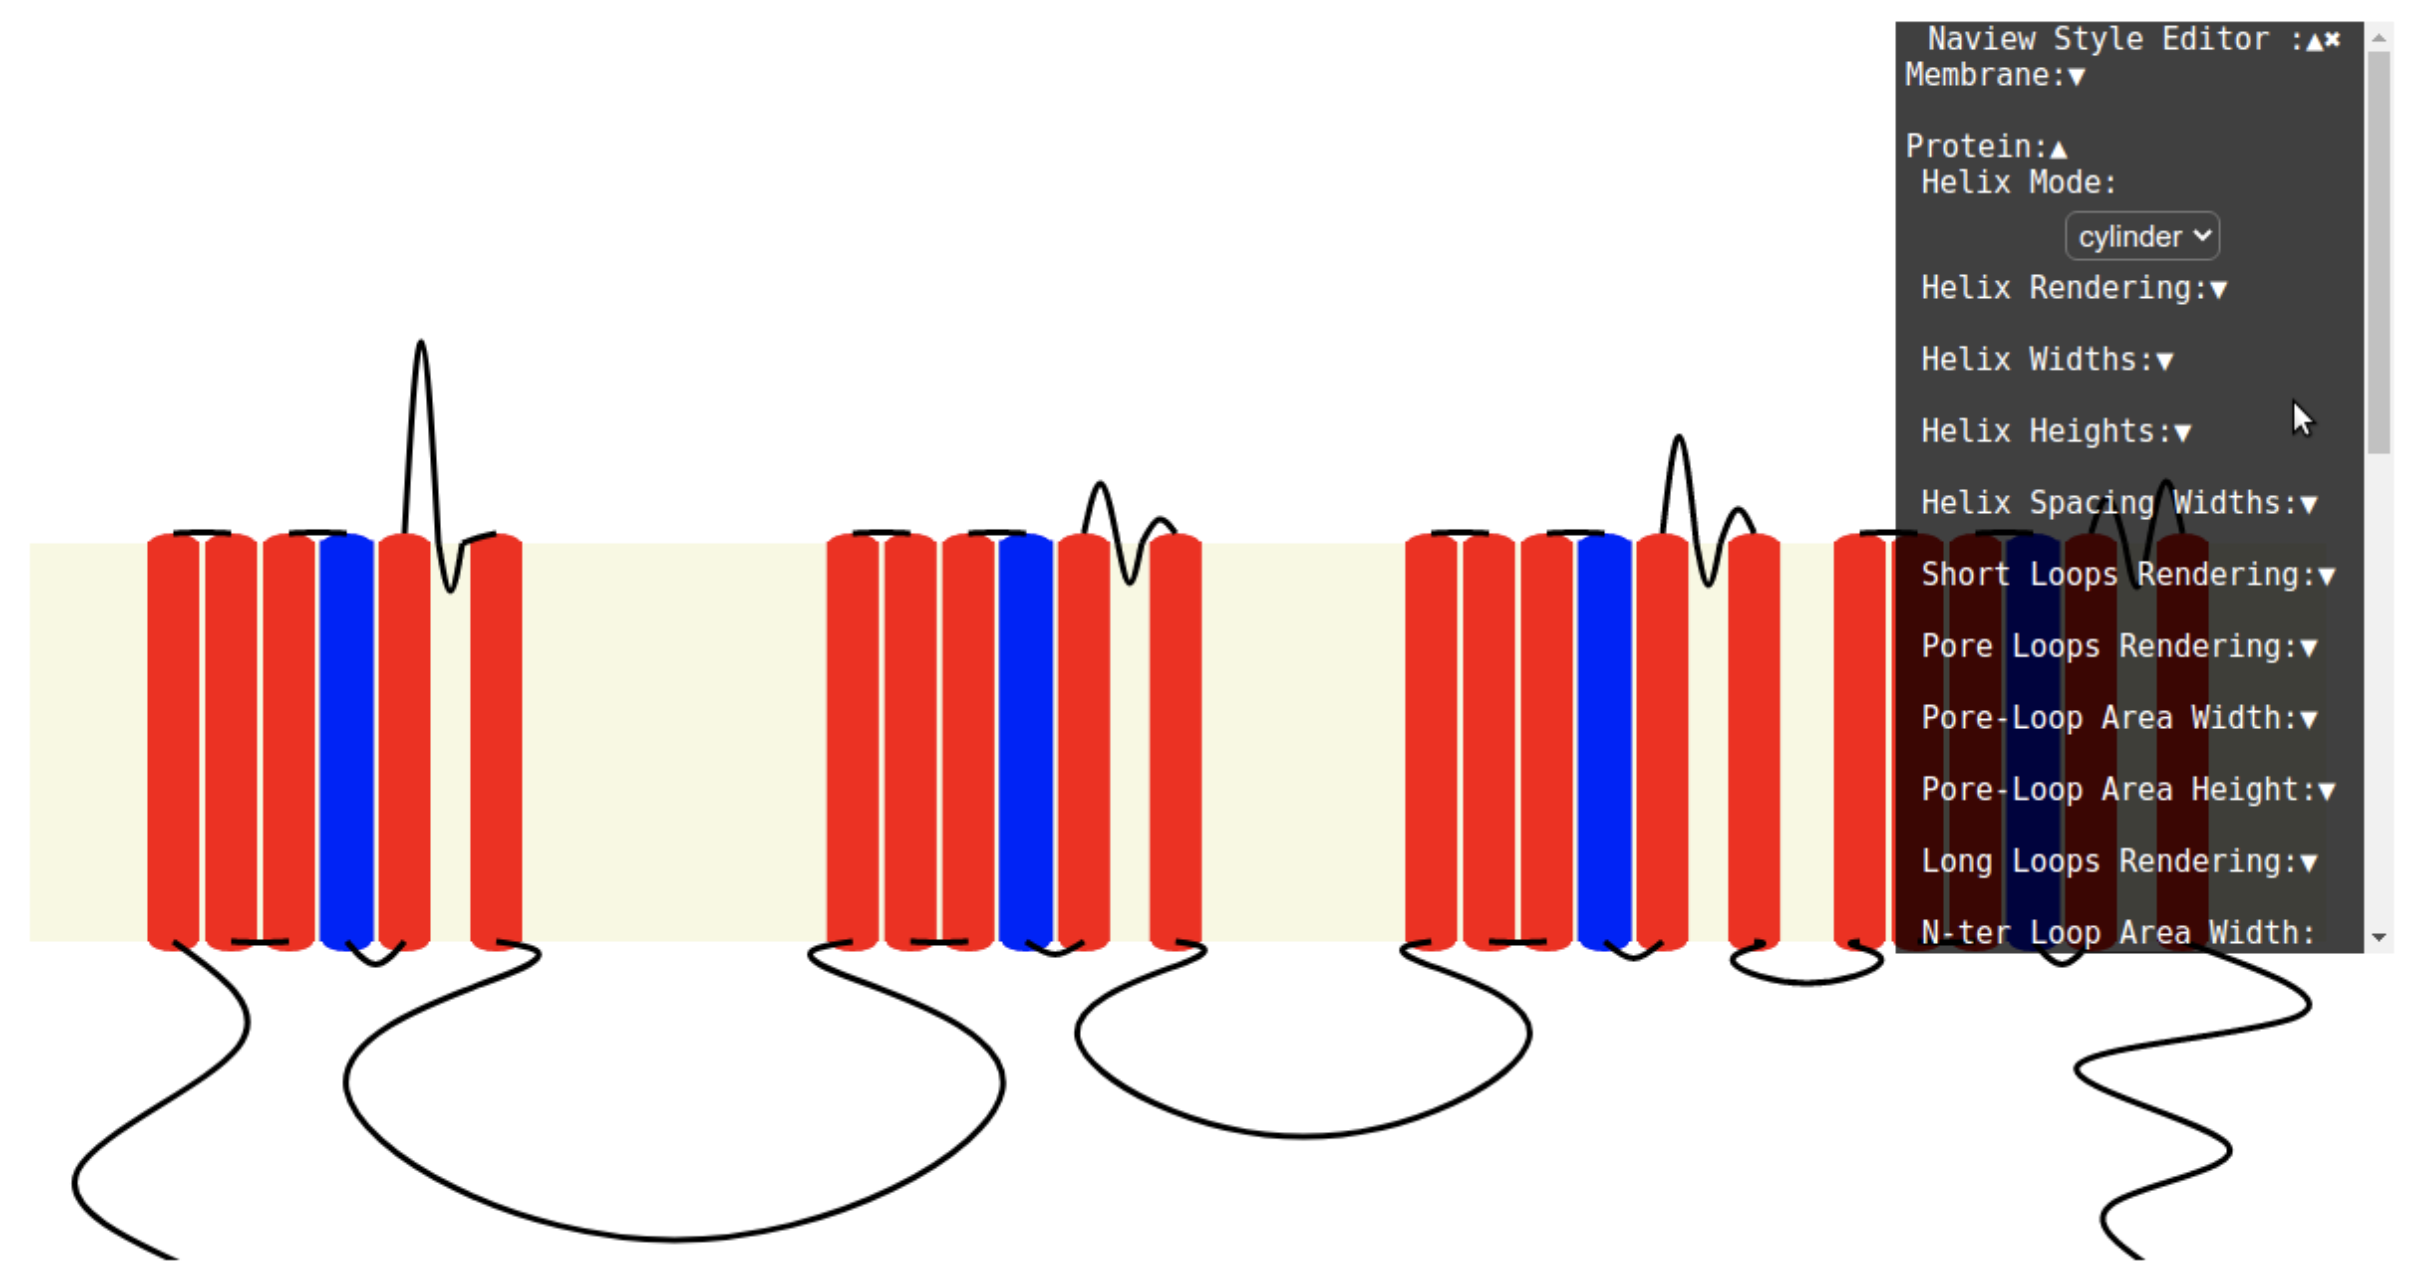
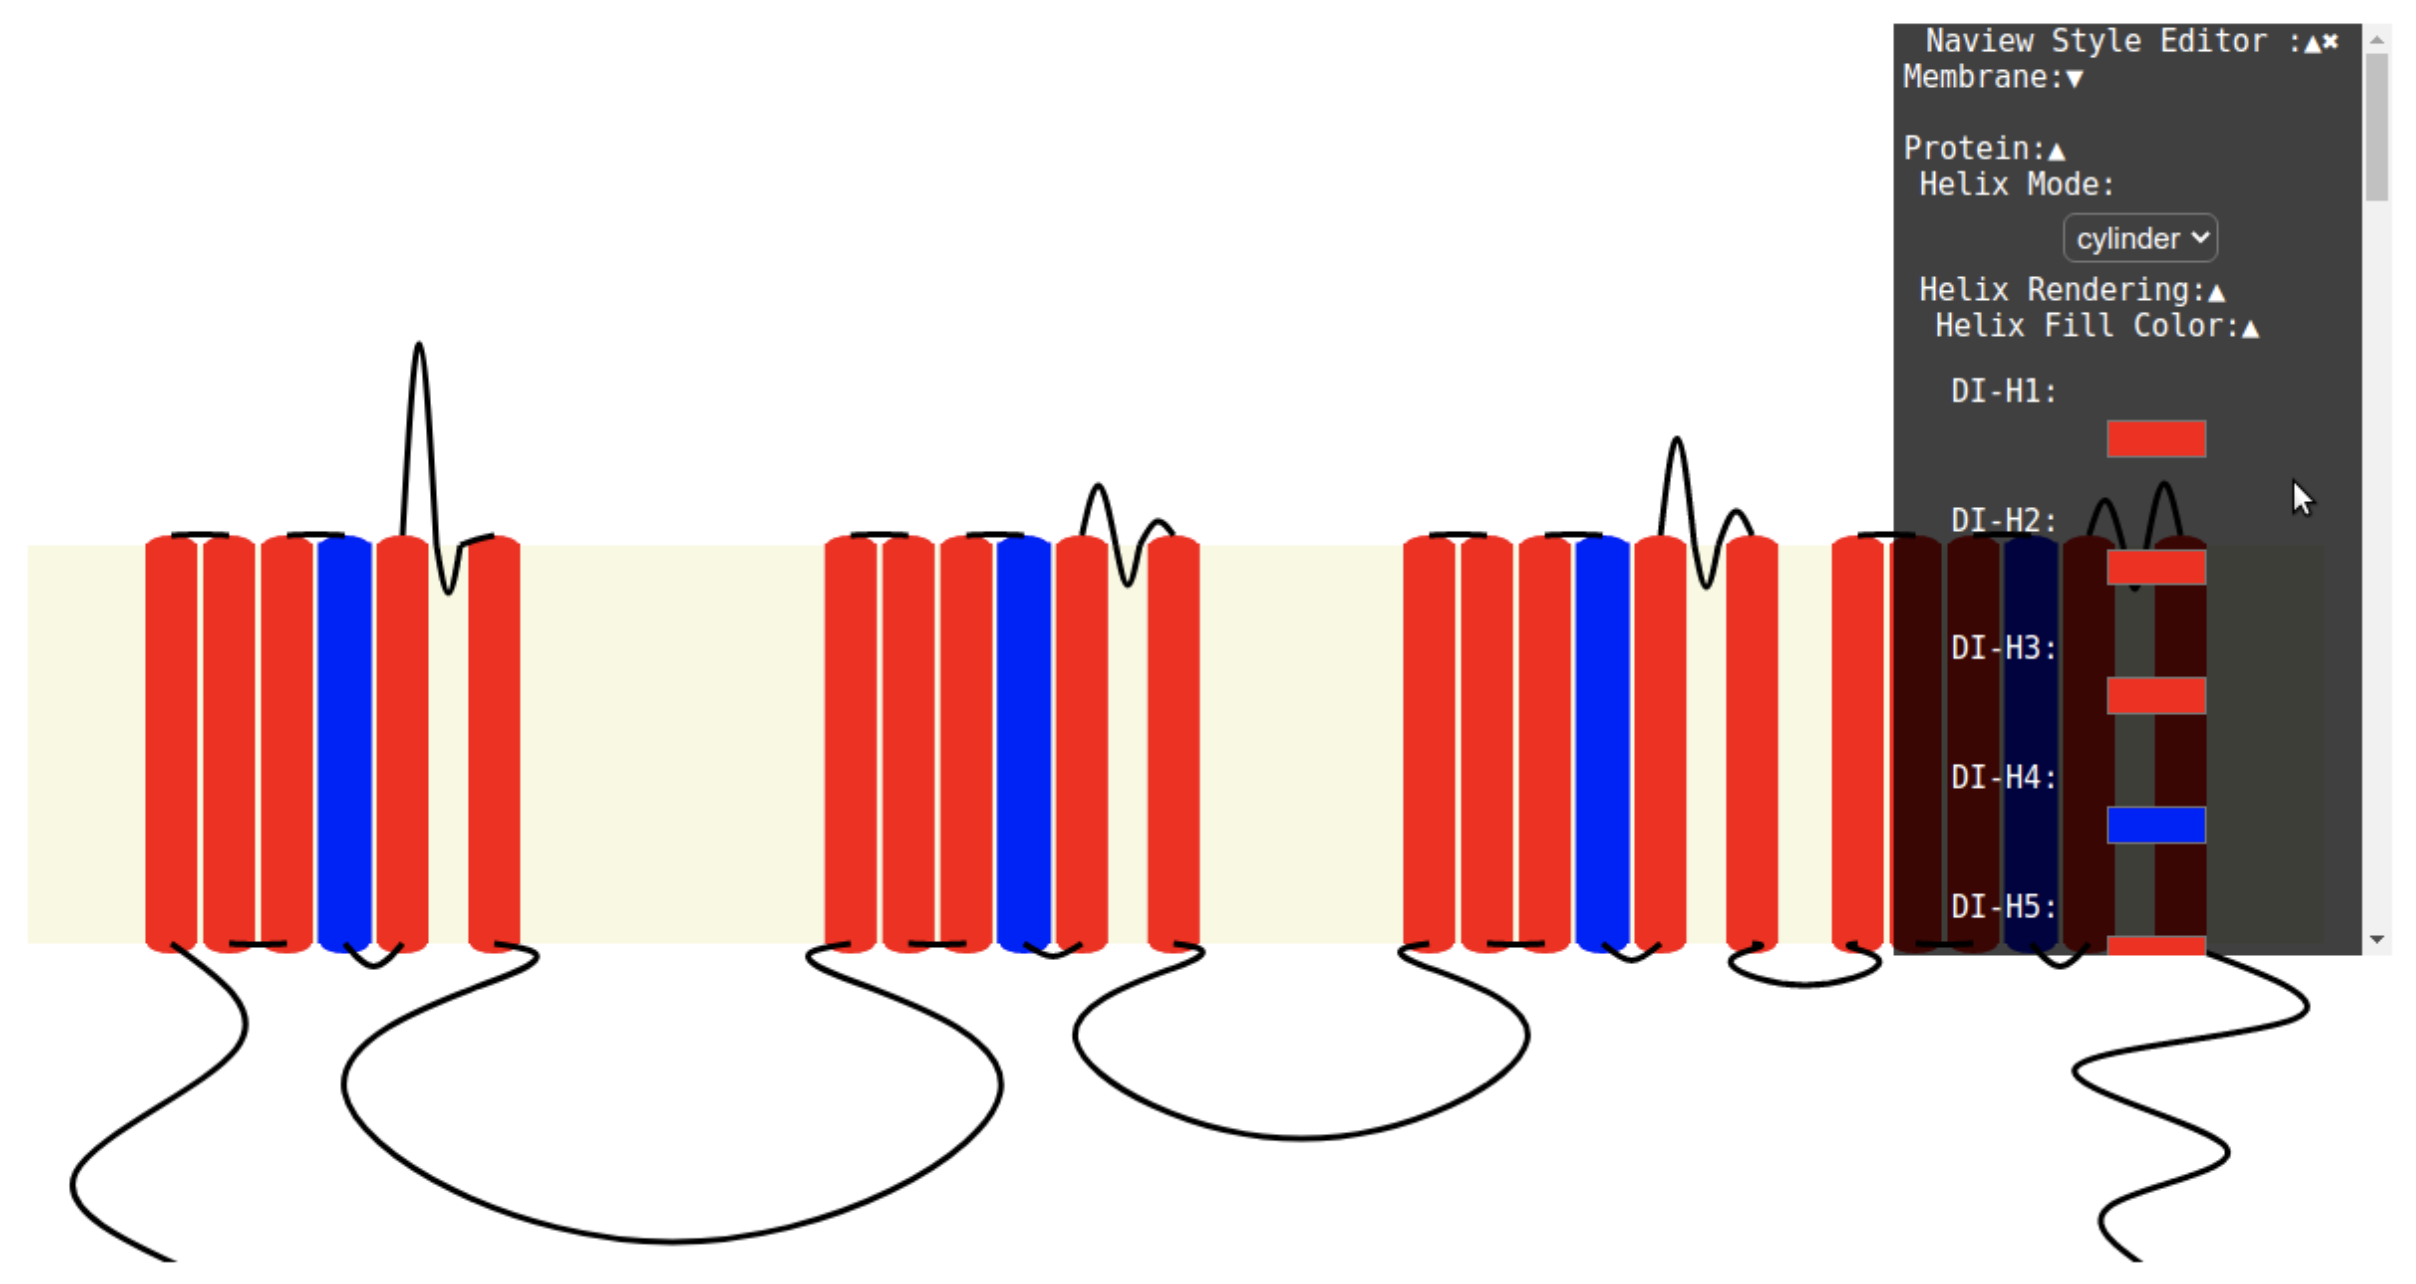
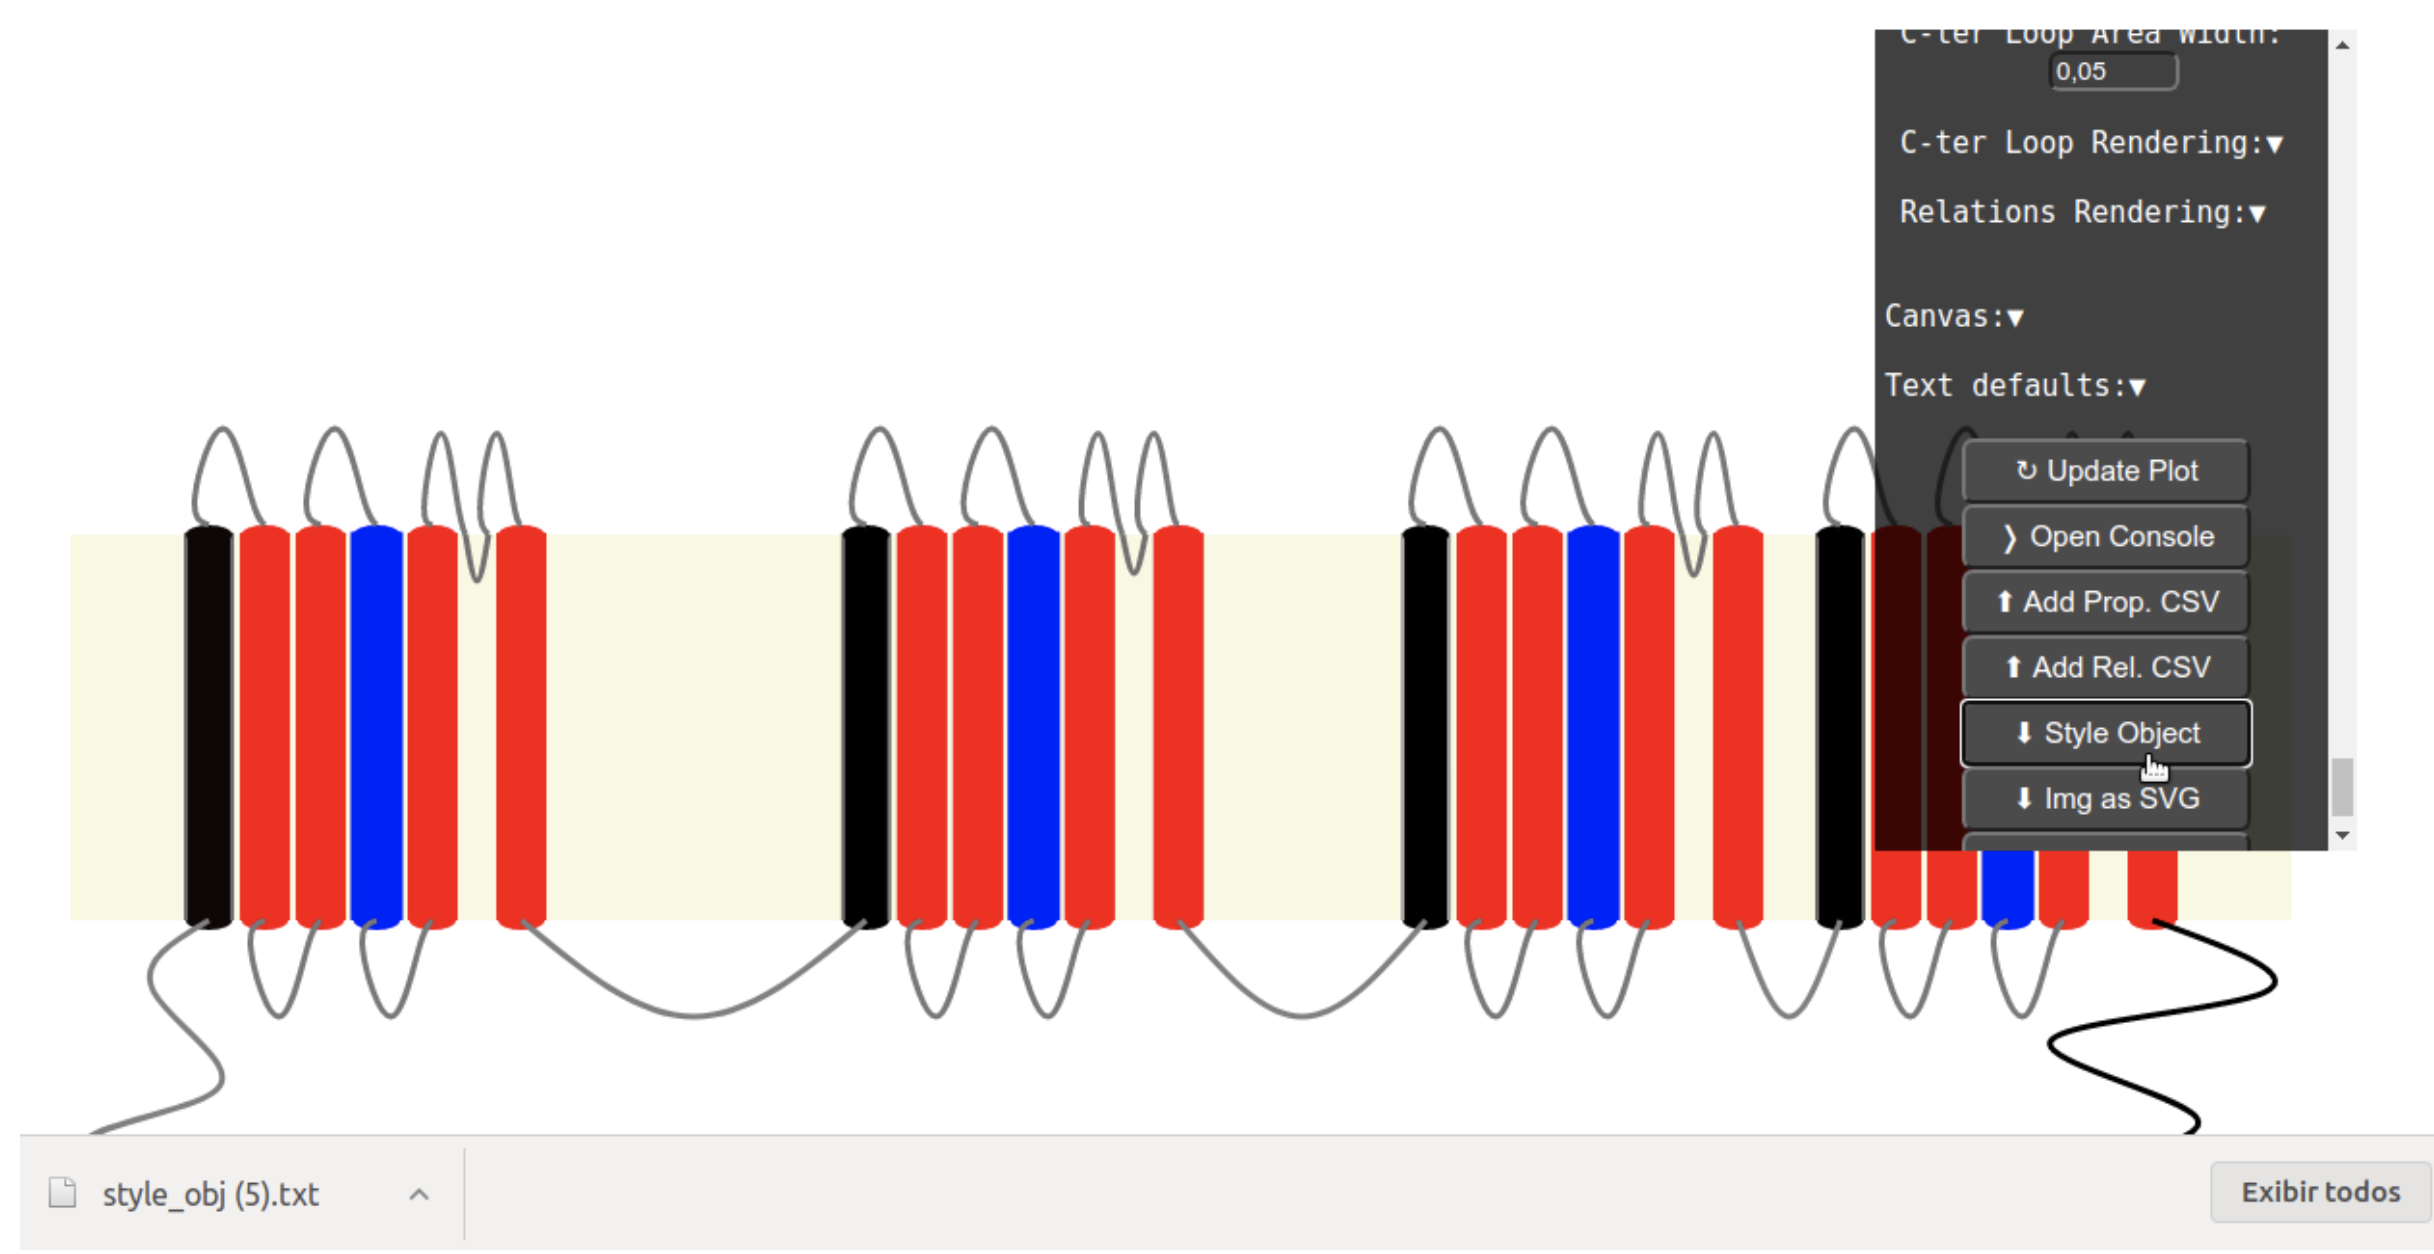
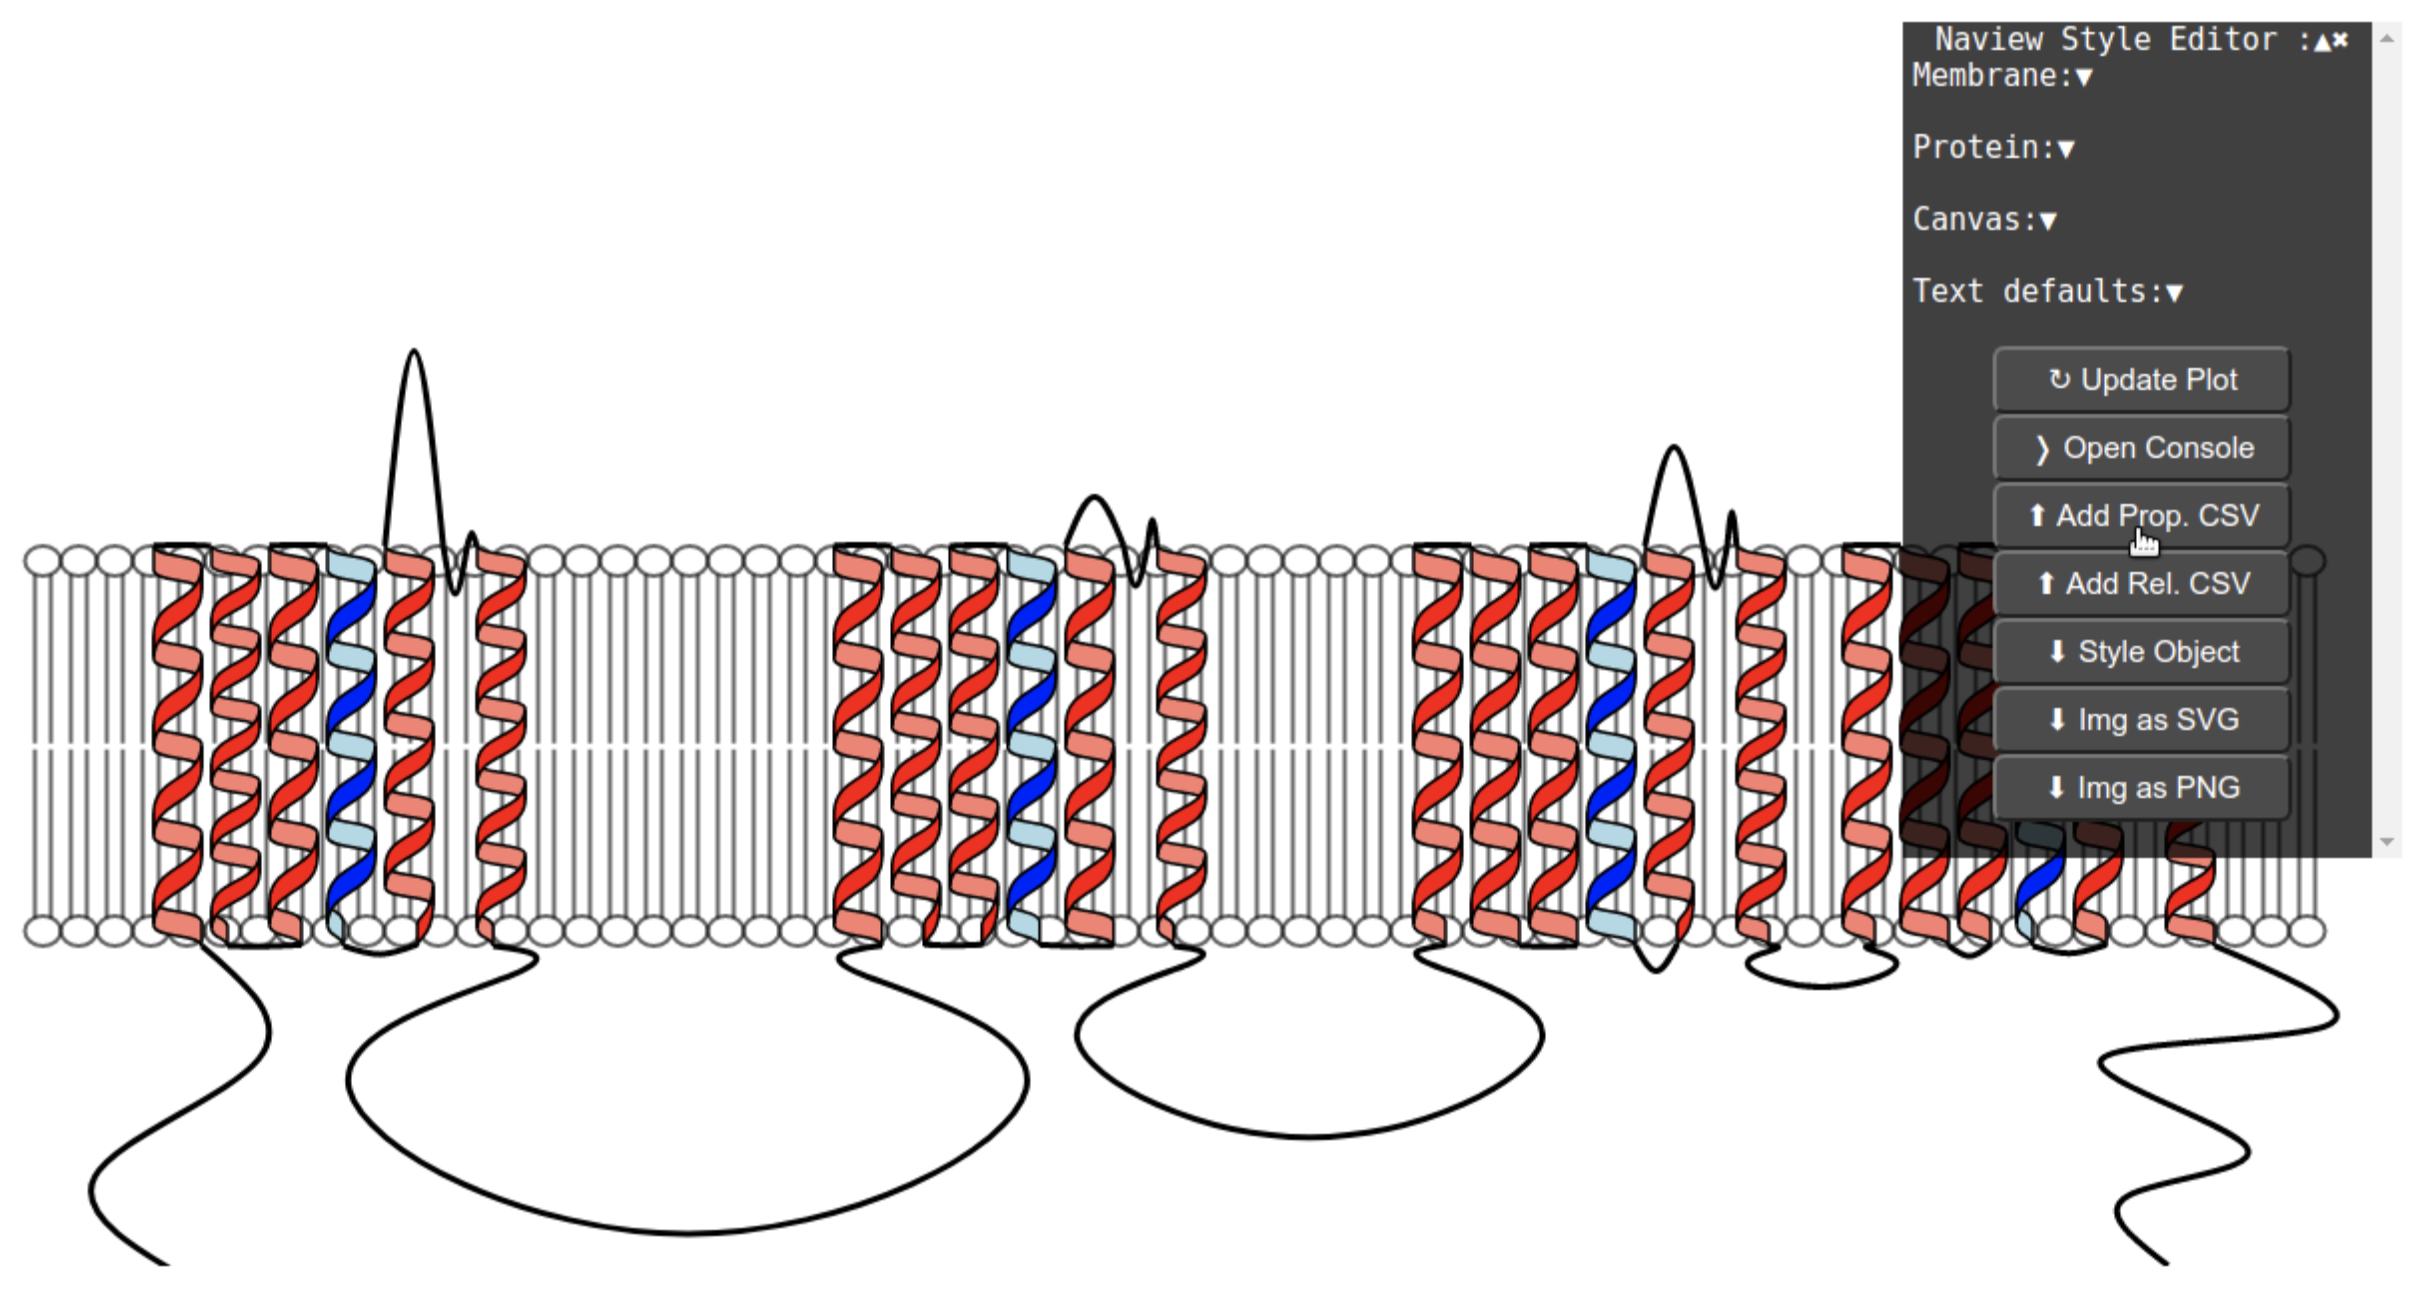
Style customization
Drawing properties can be defined by a JSON Object and rendered in a similar manner to the text annotation object. Note that most of the style object has been omitted in the example below for clarity. A tutorial on how to customize the drawn using the Style editor can also be seen here.
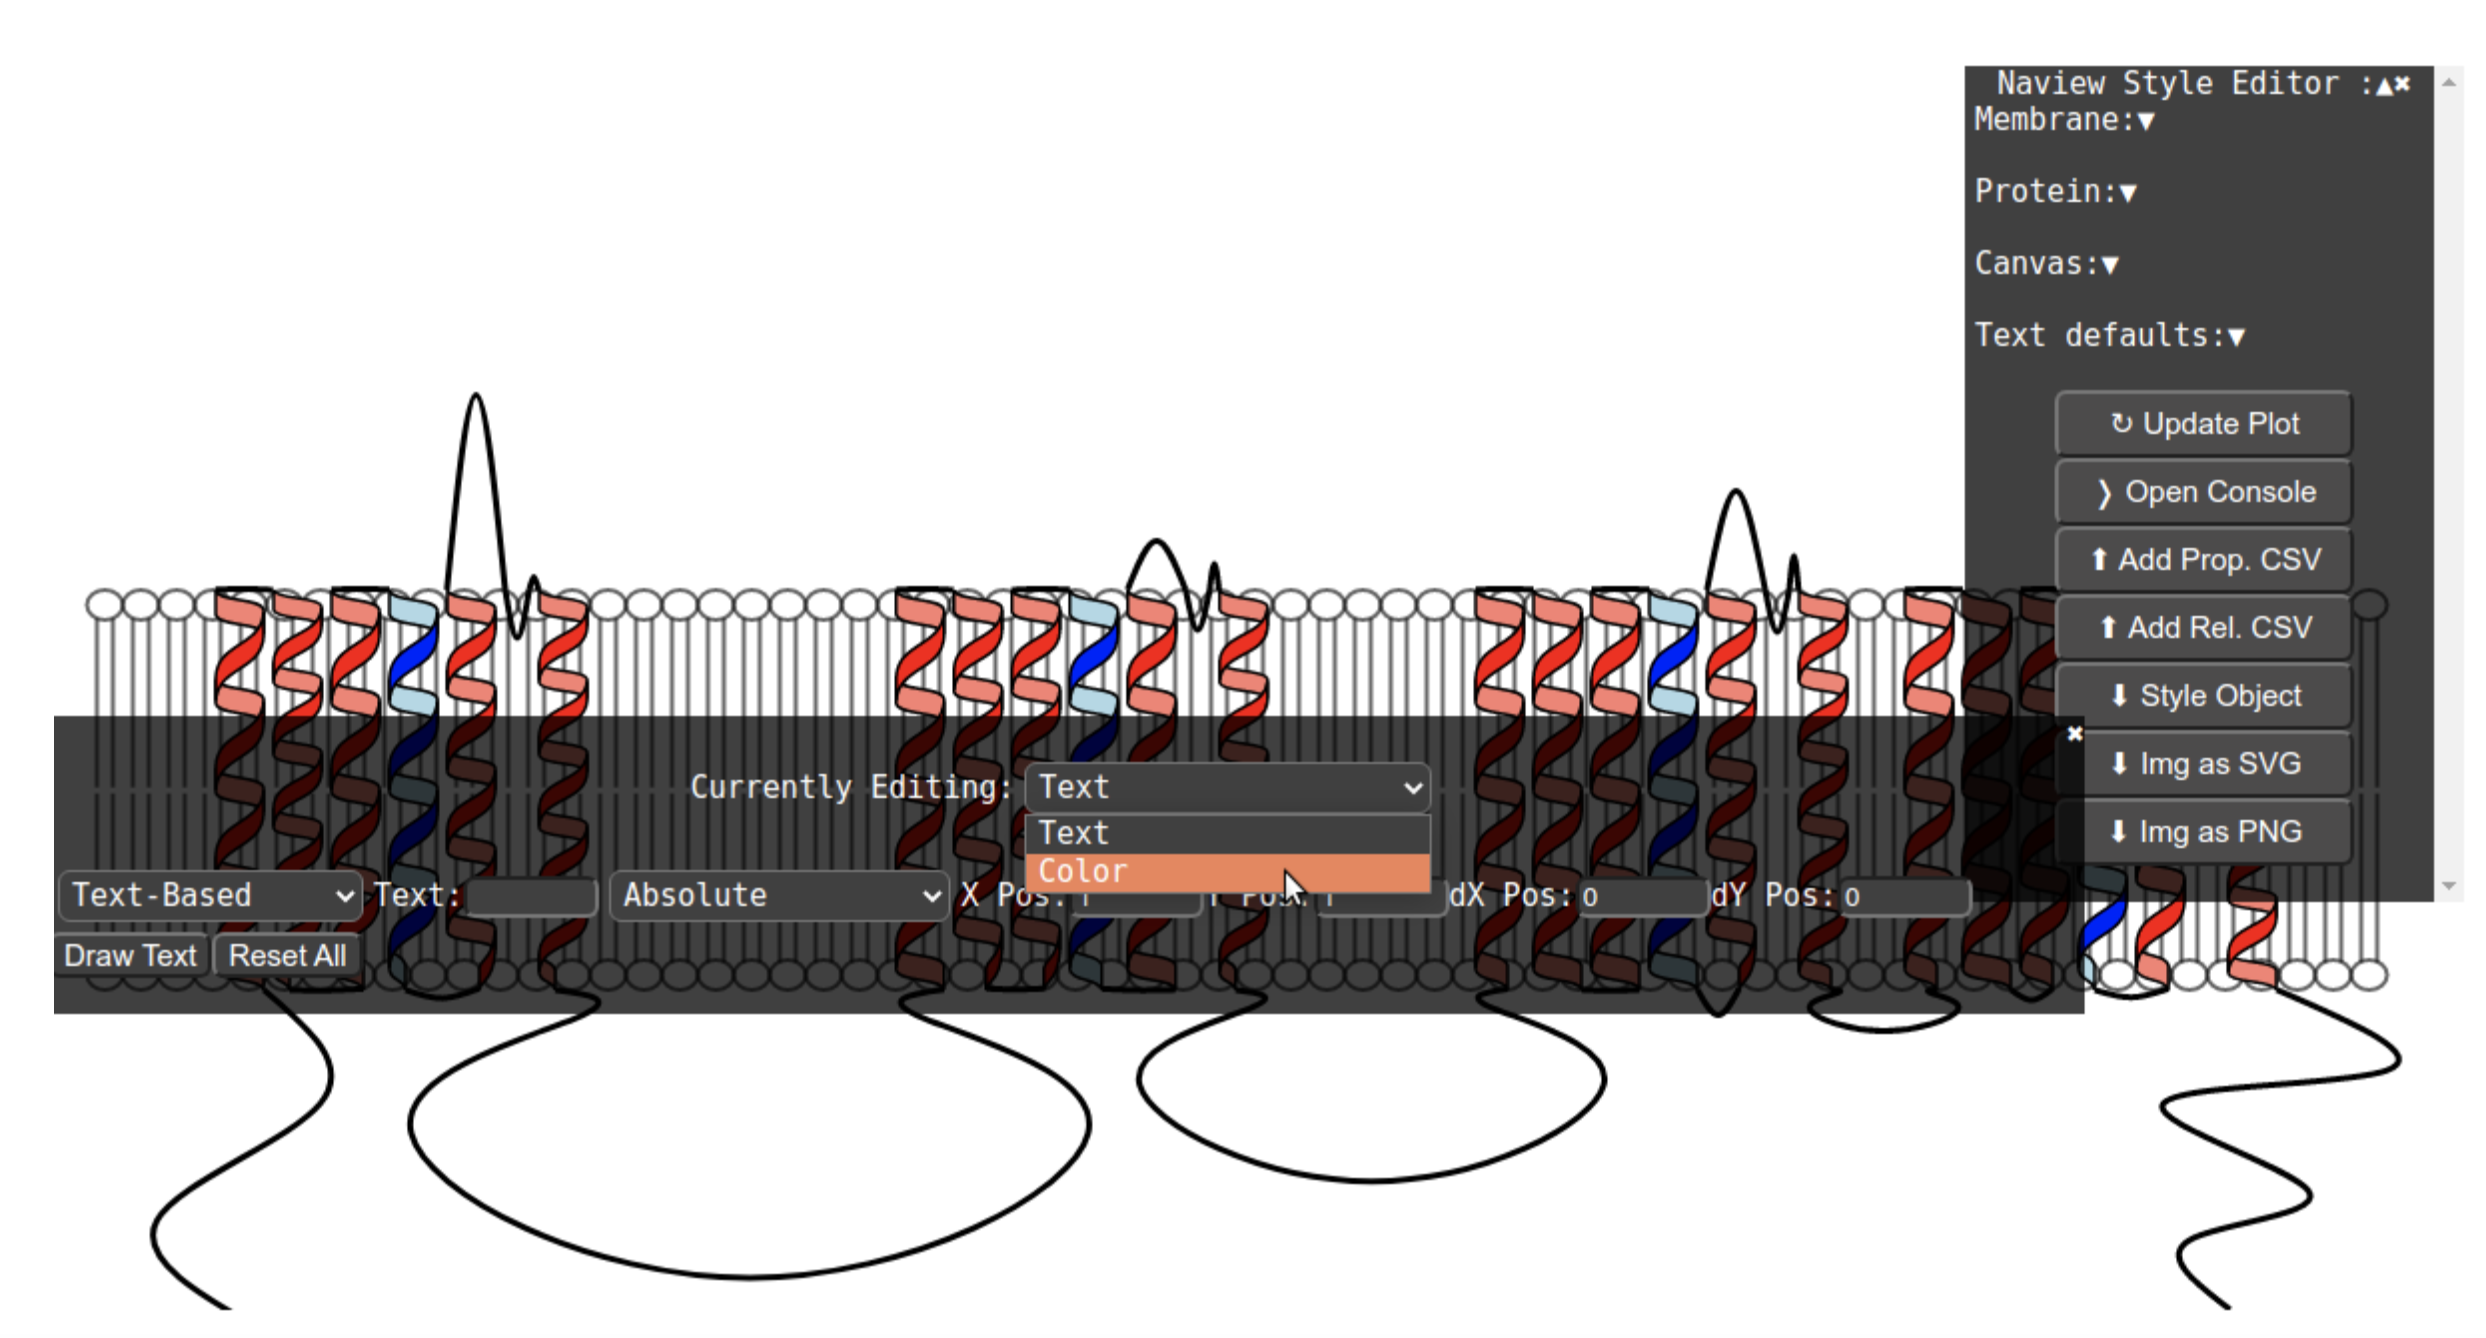
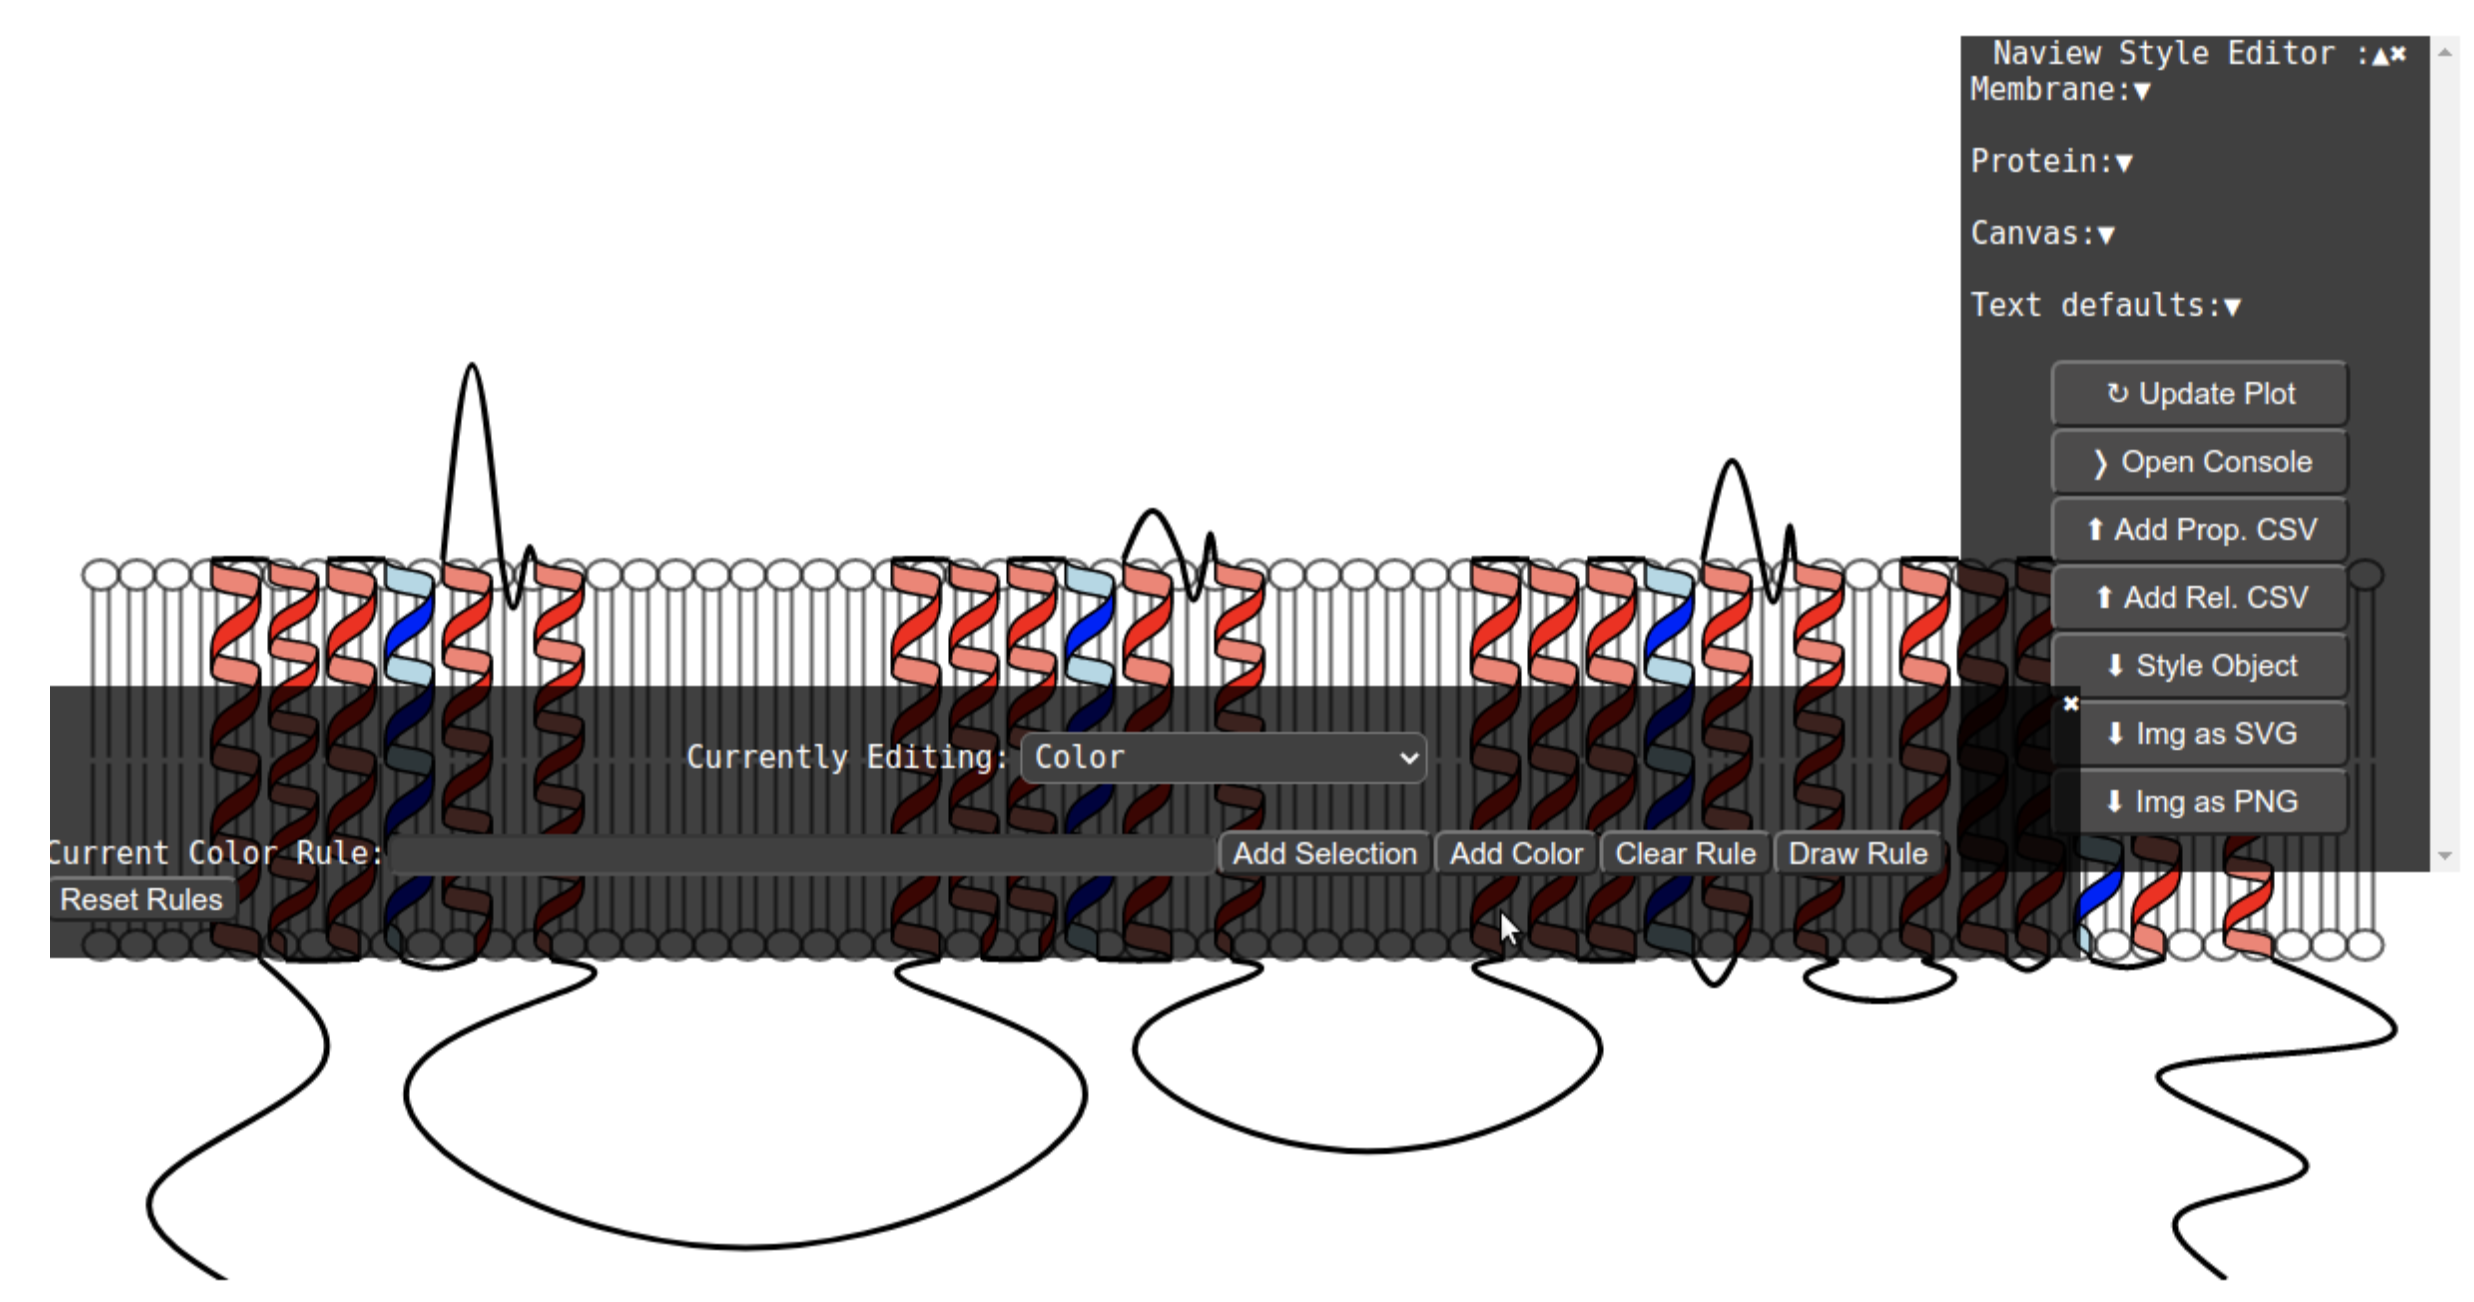
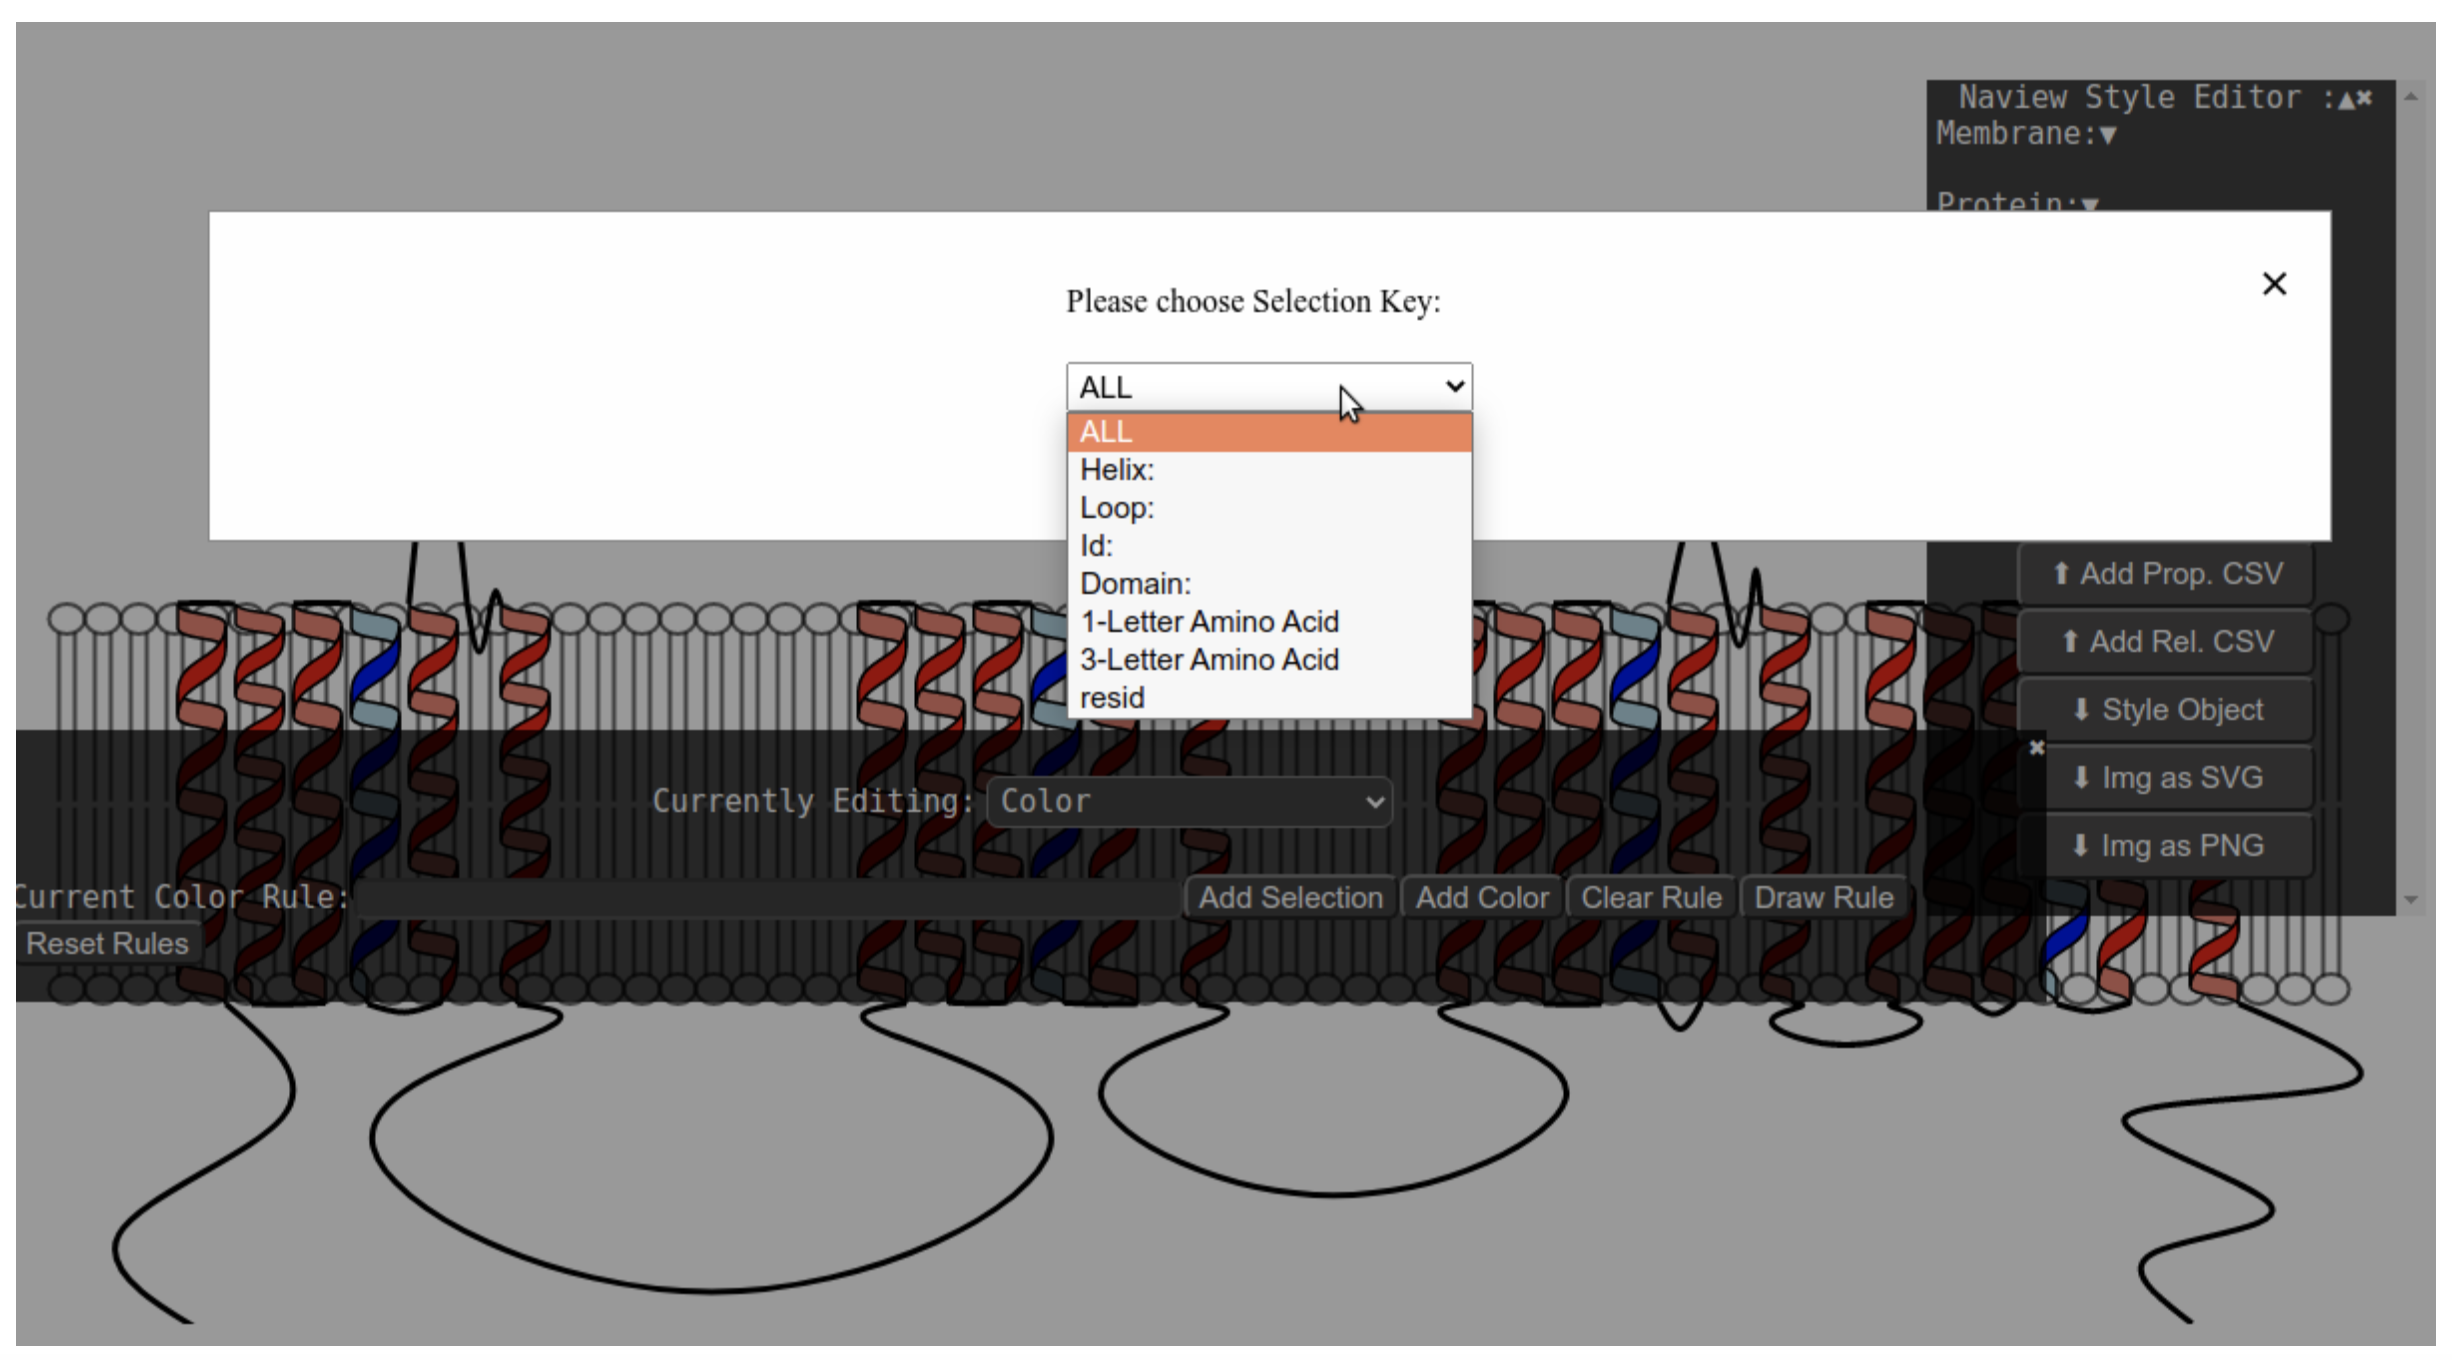
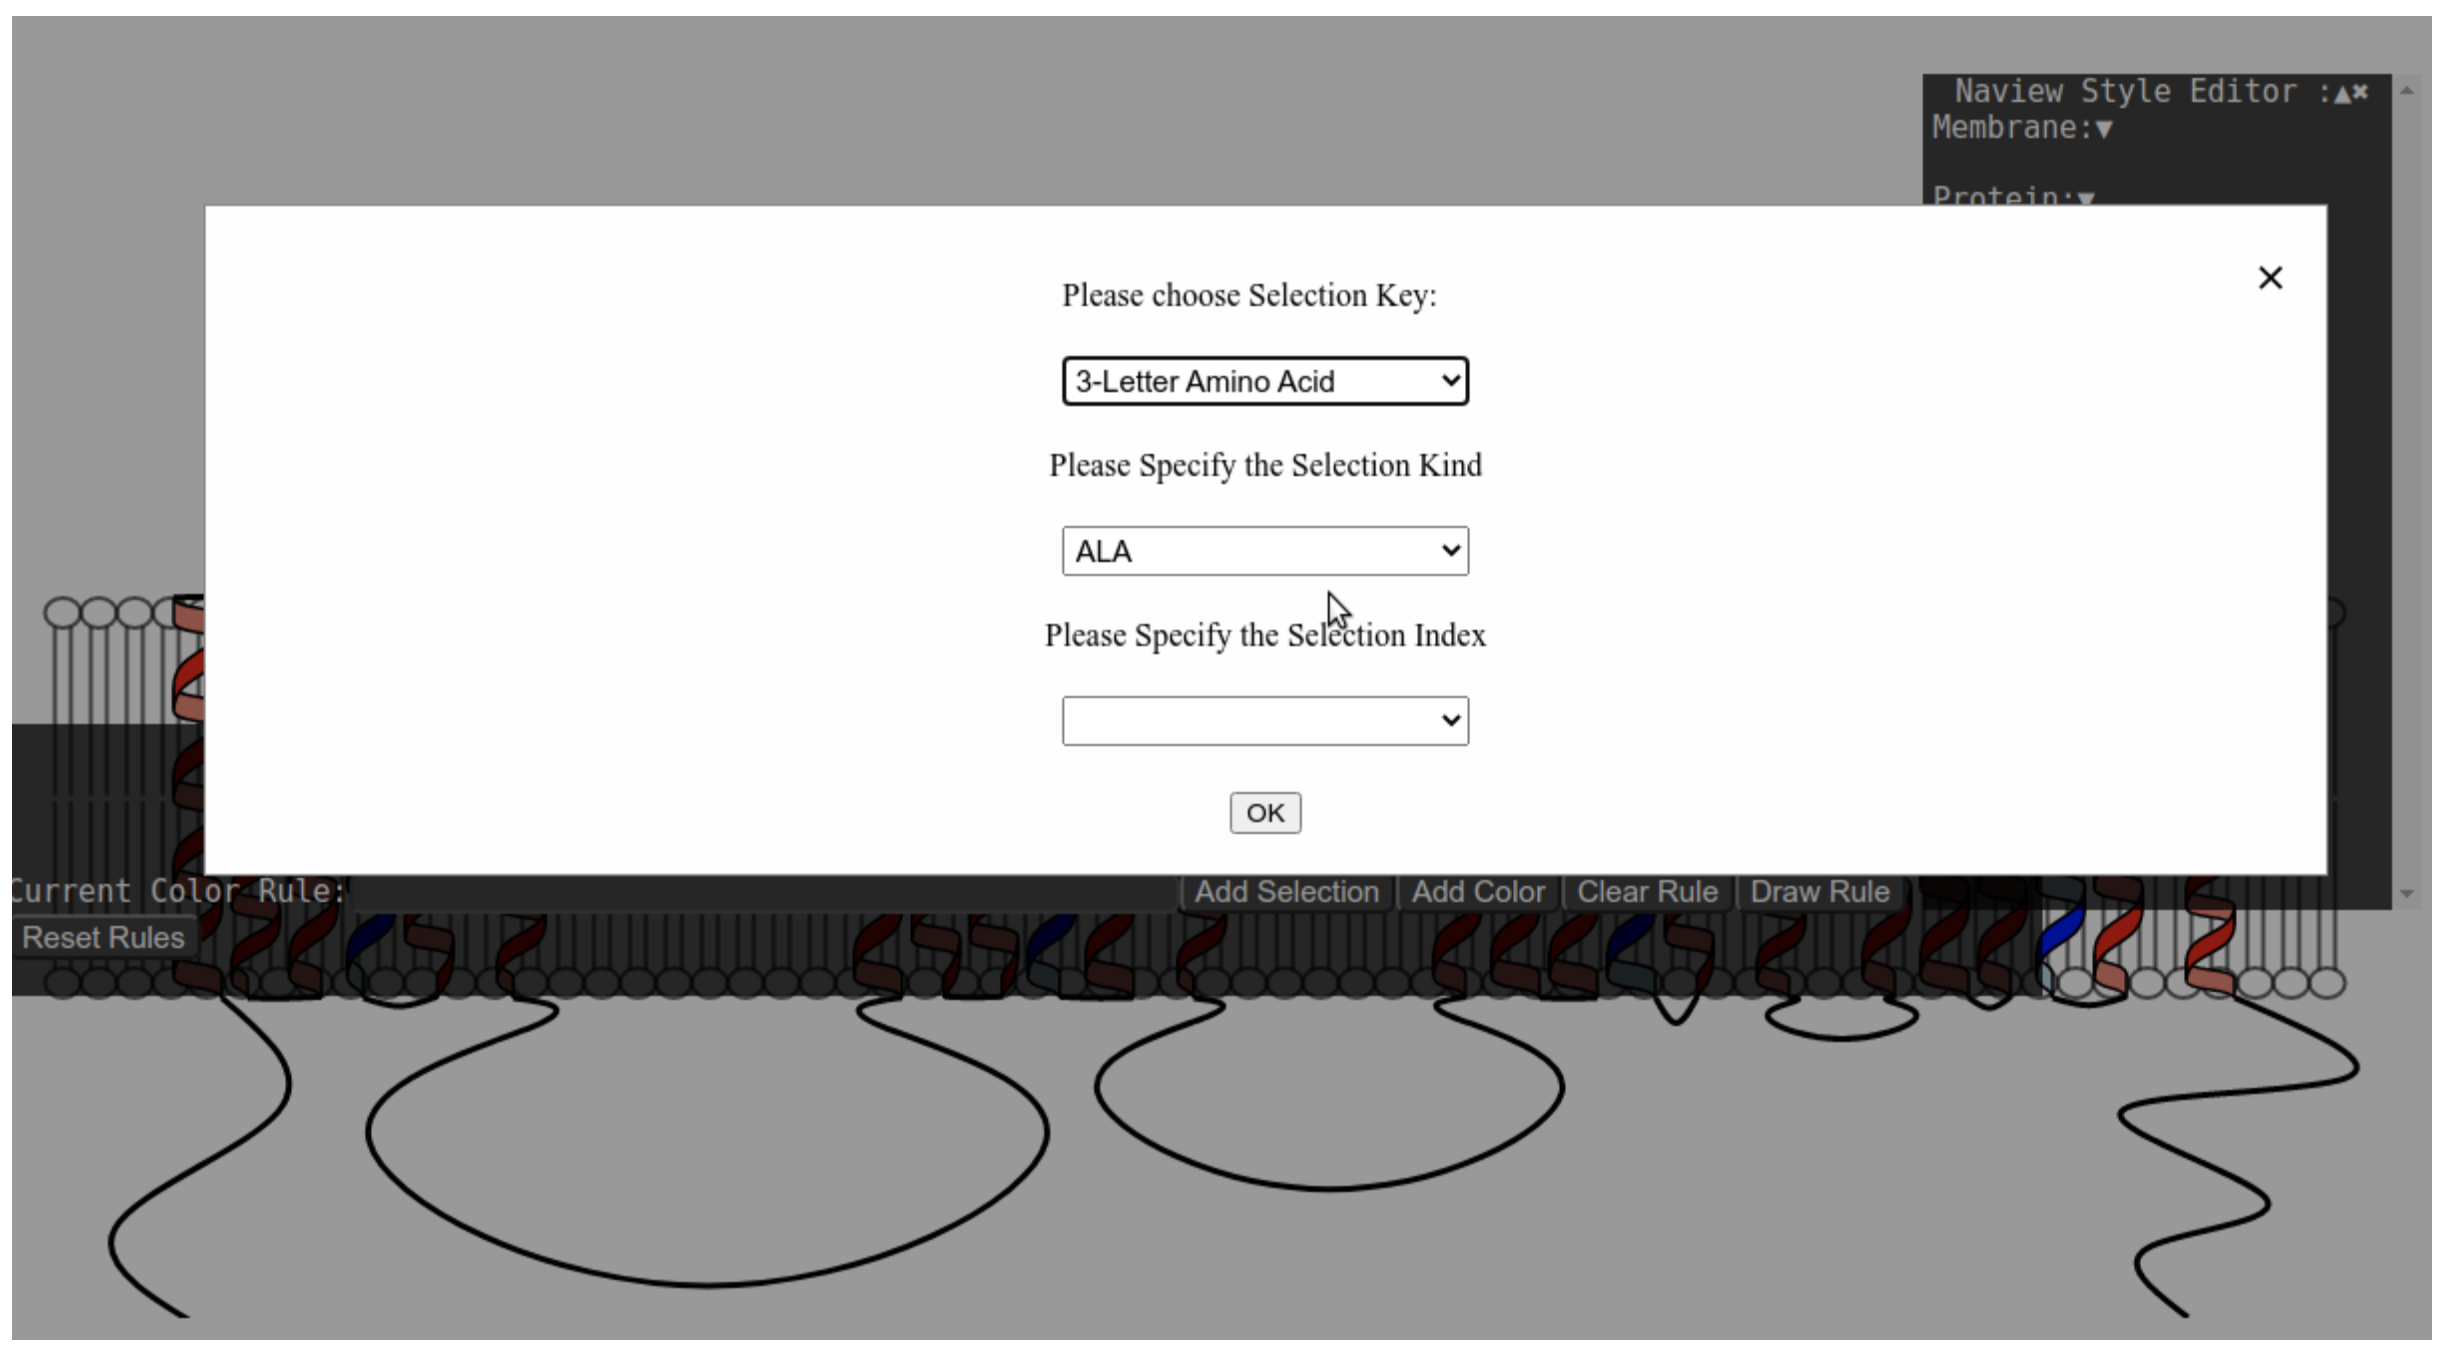
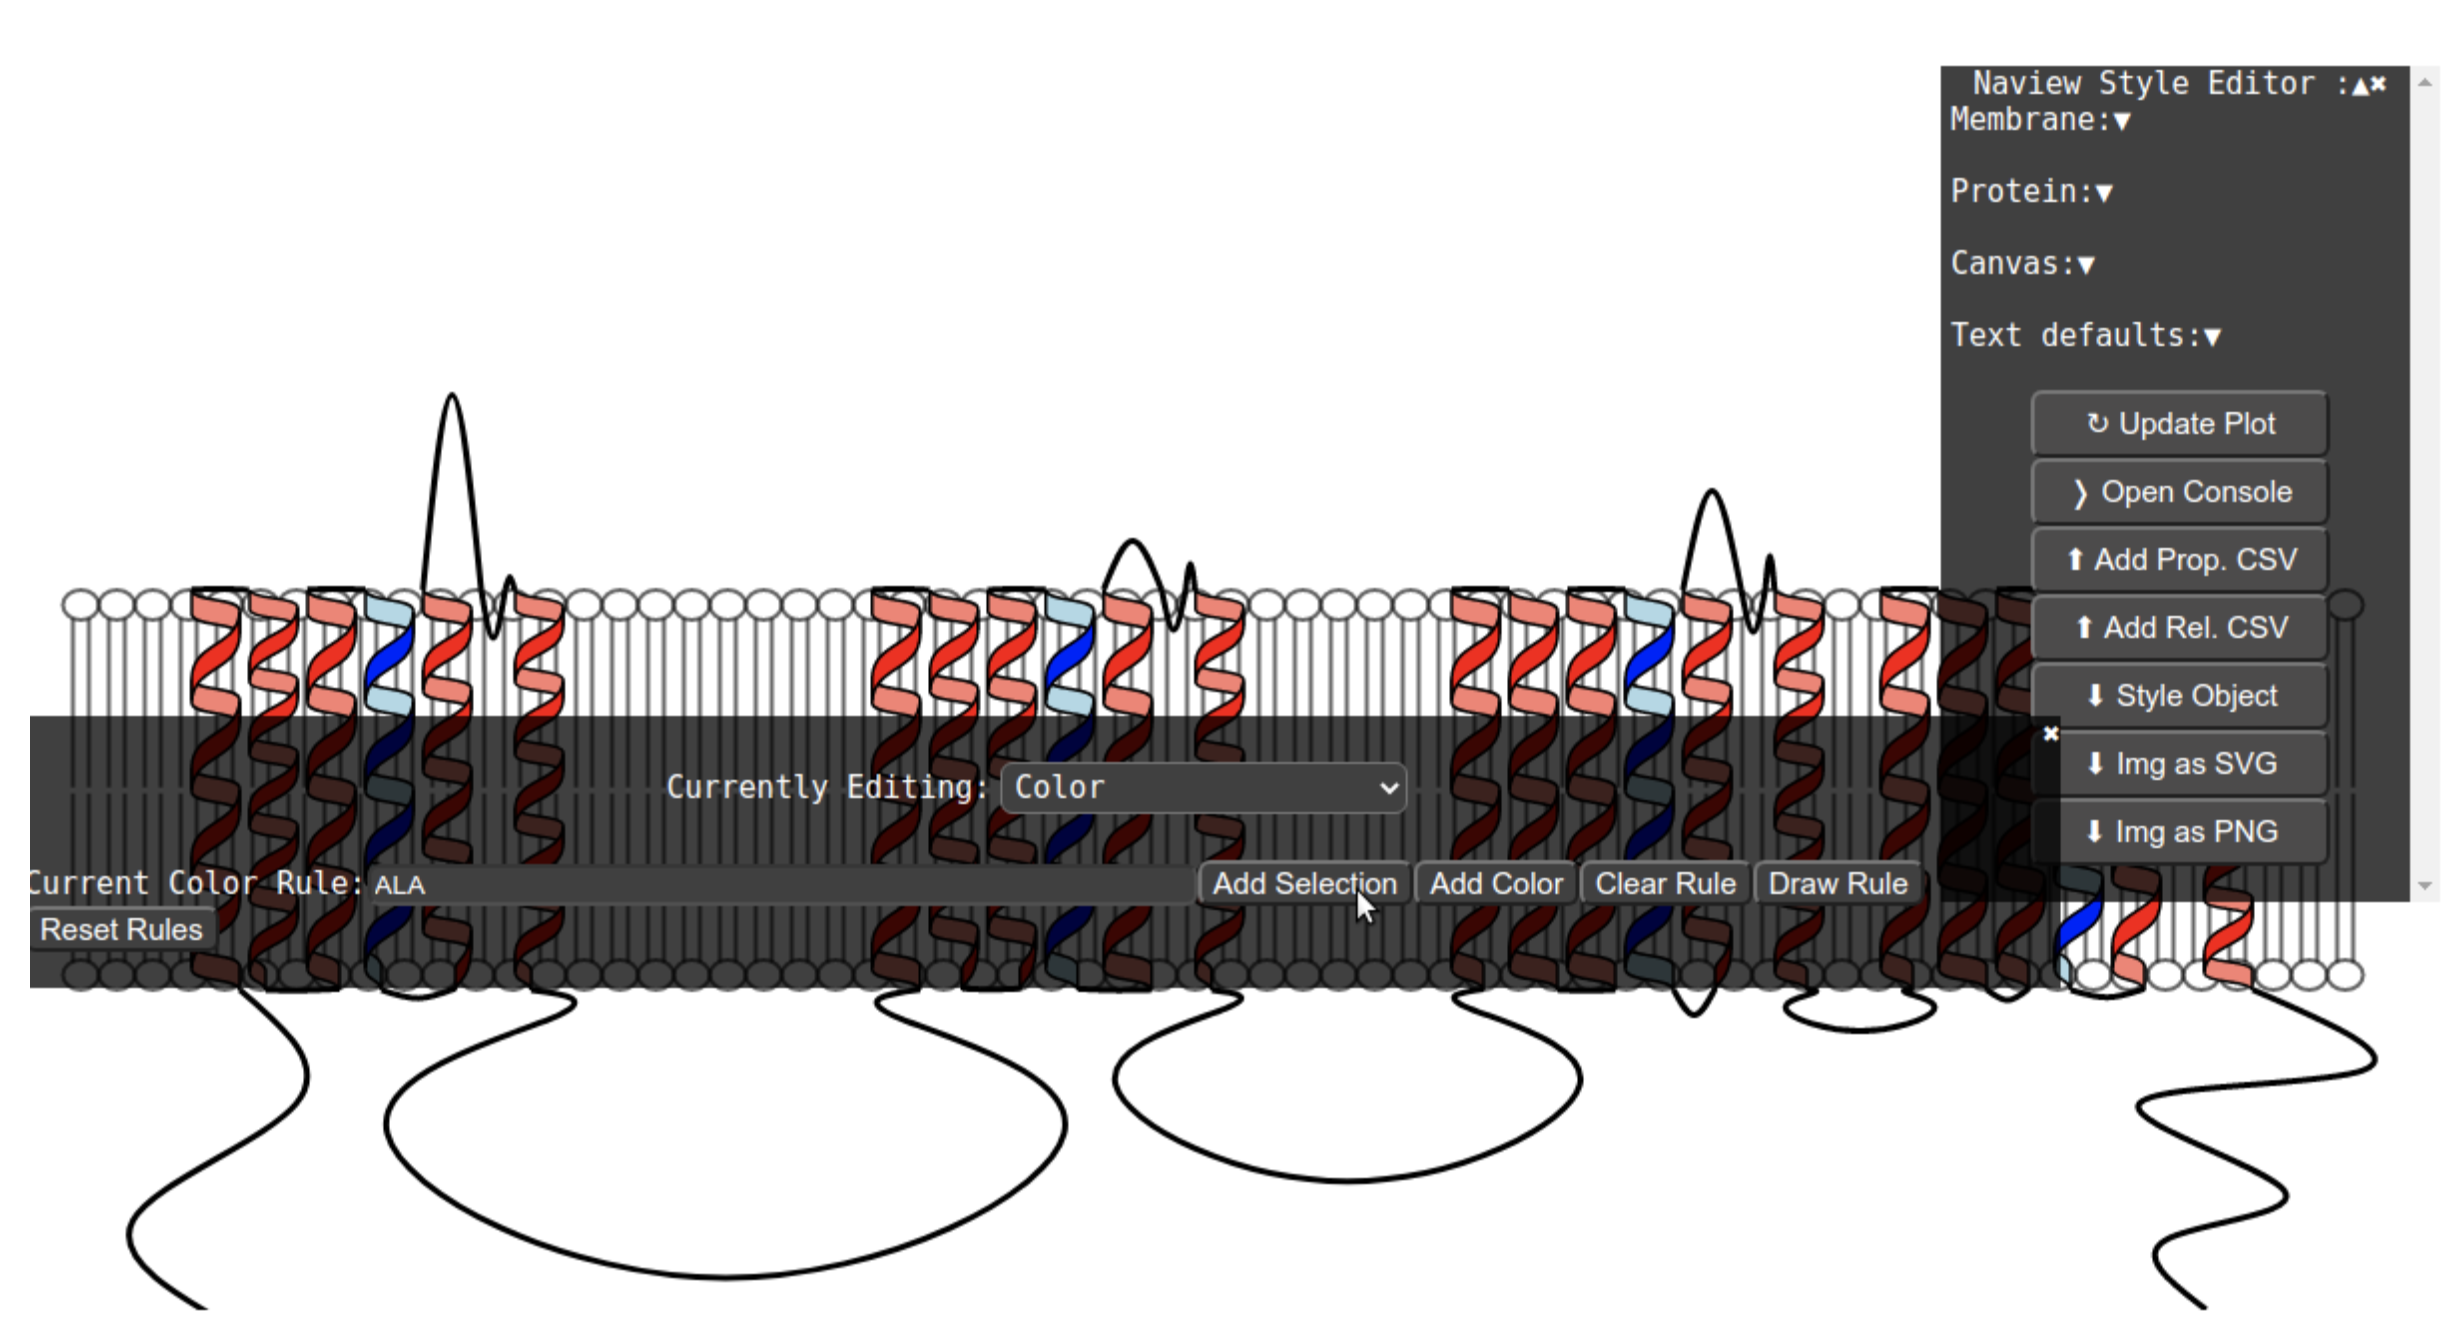
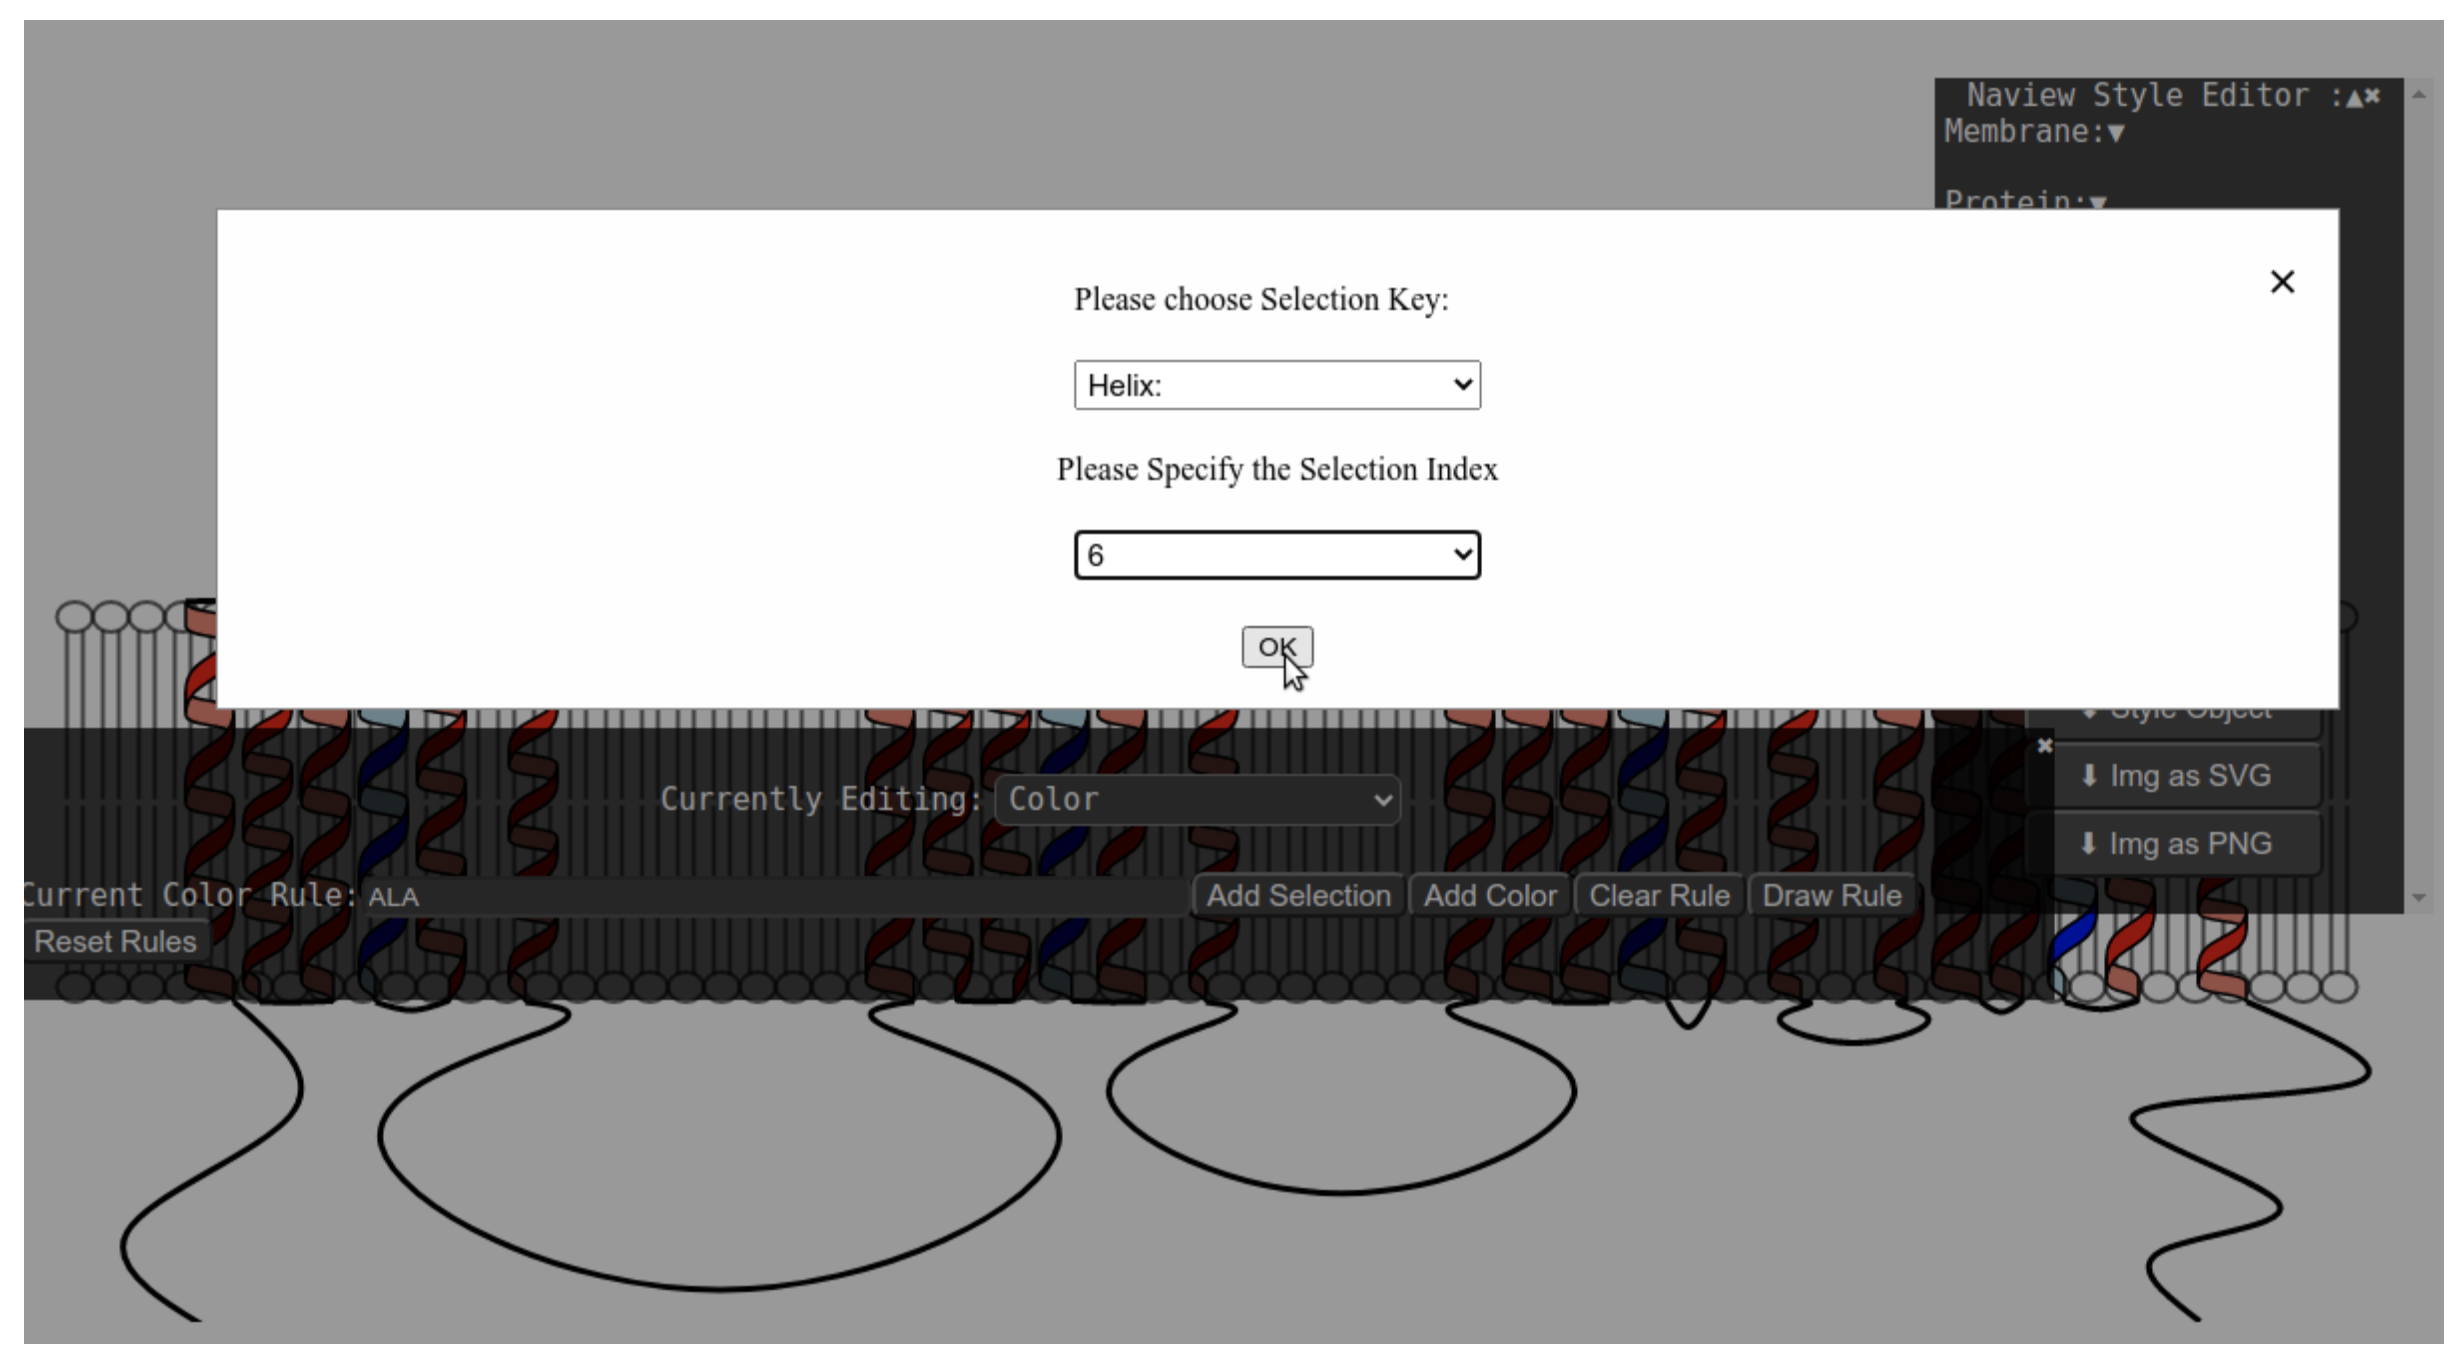
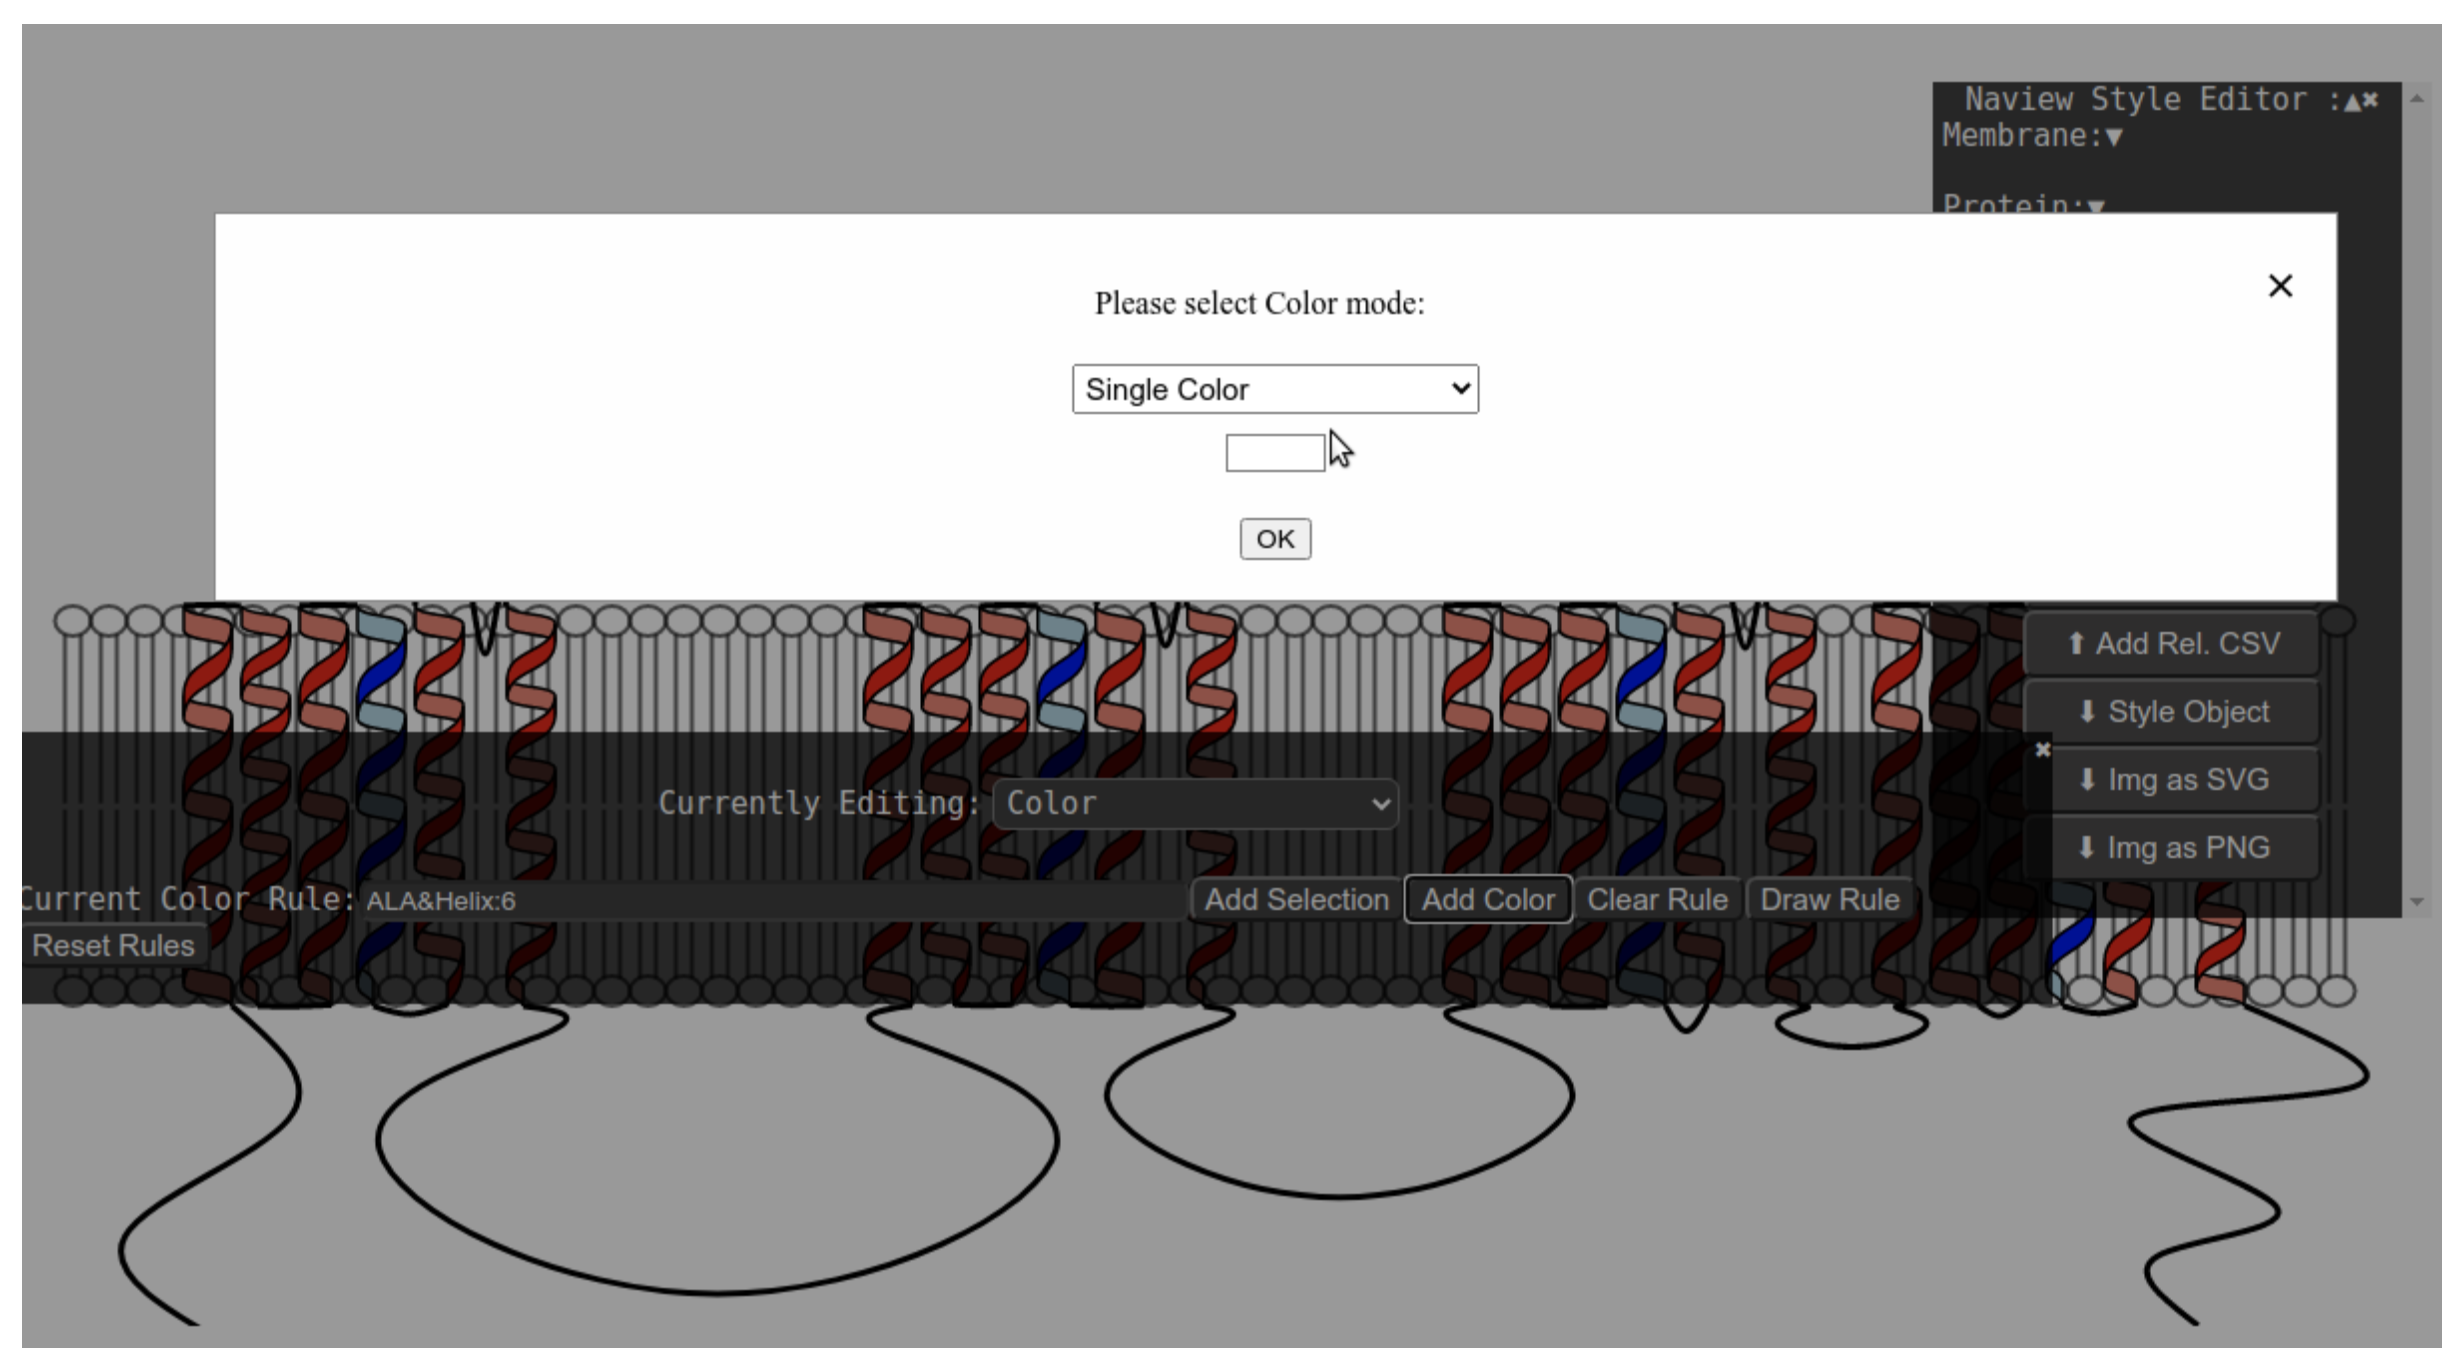
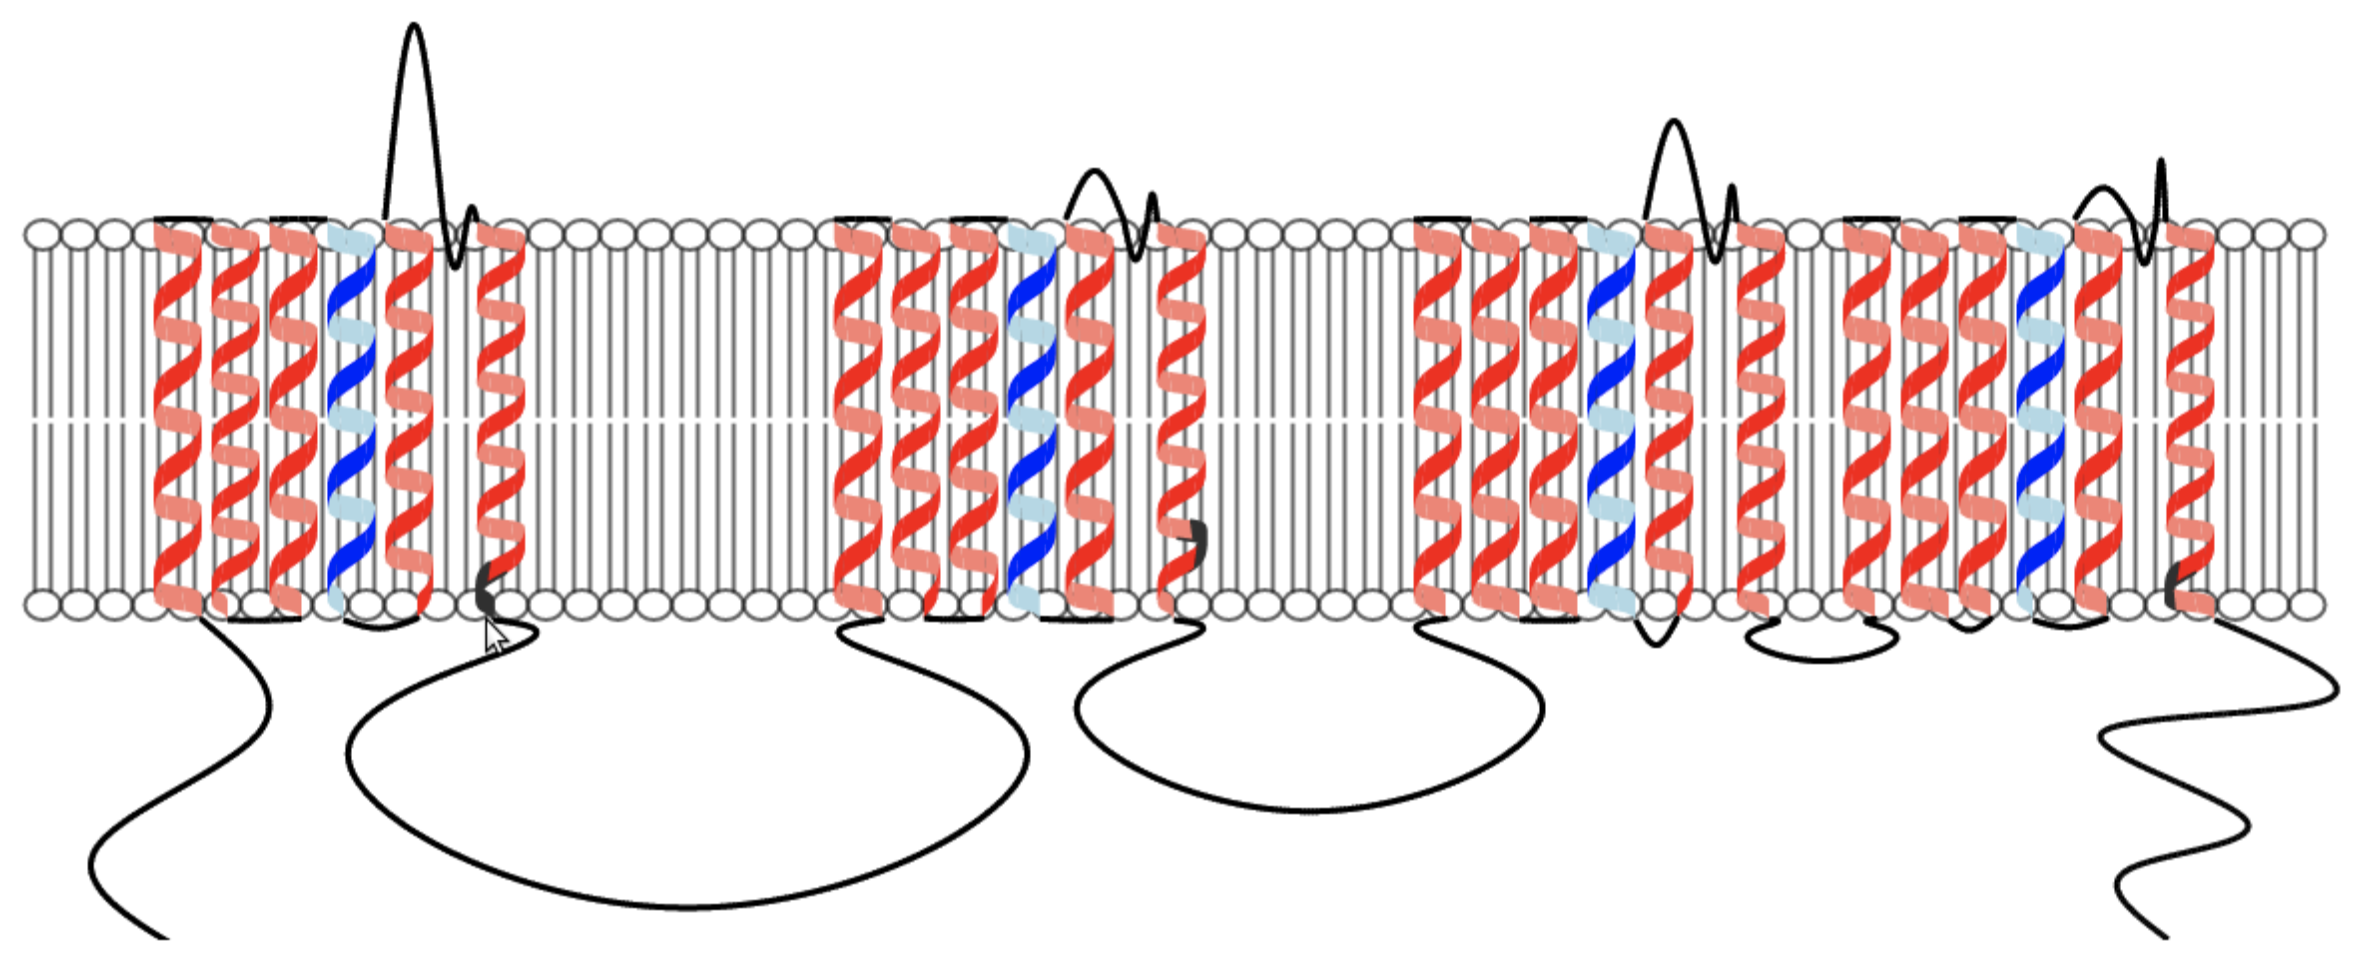
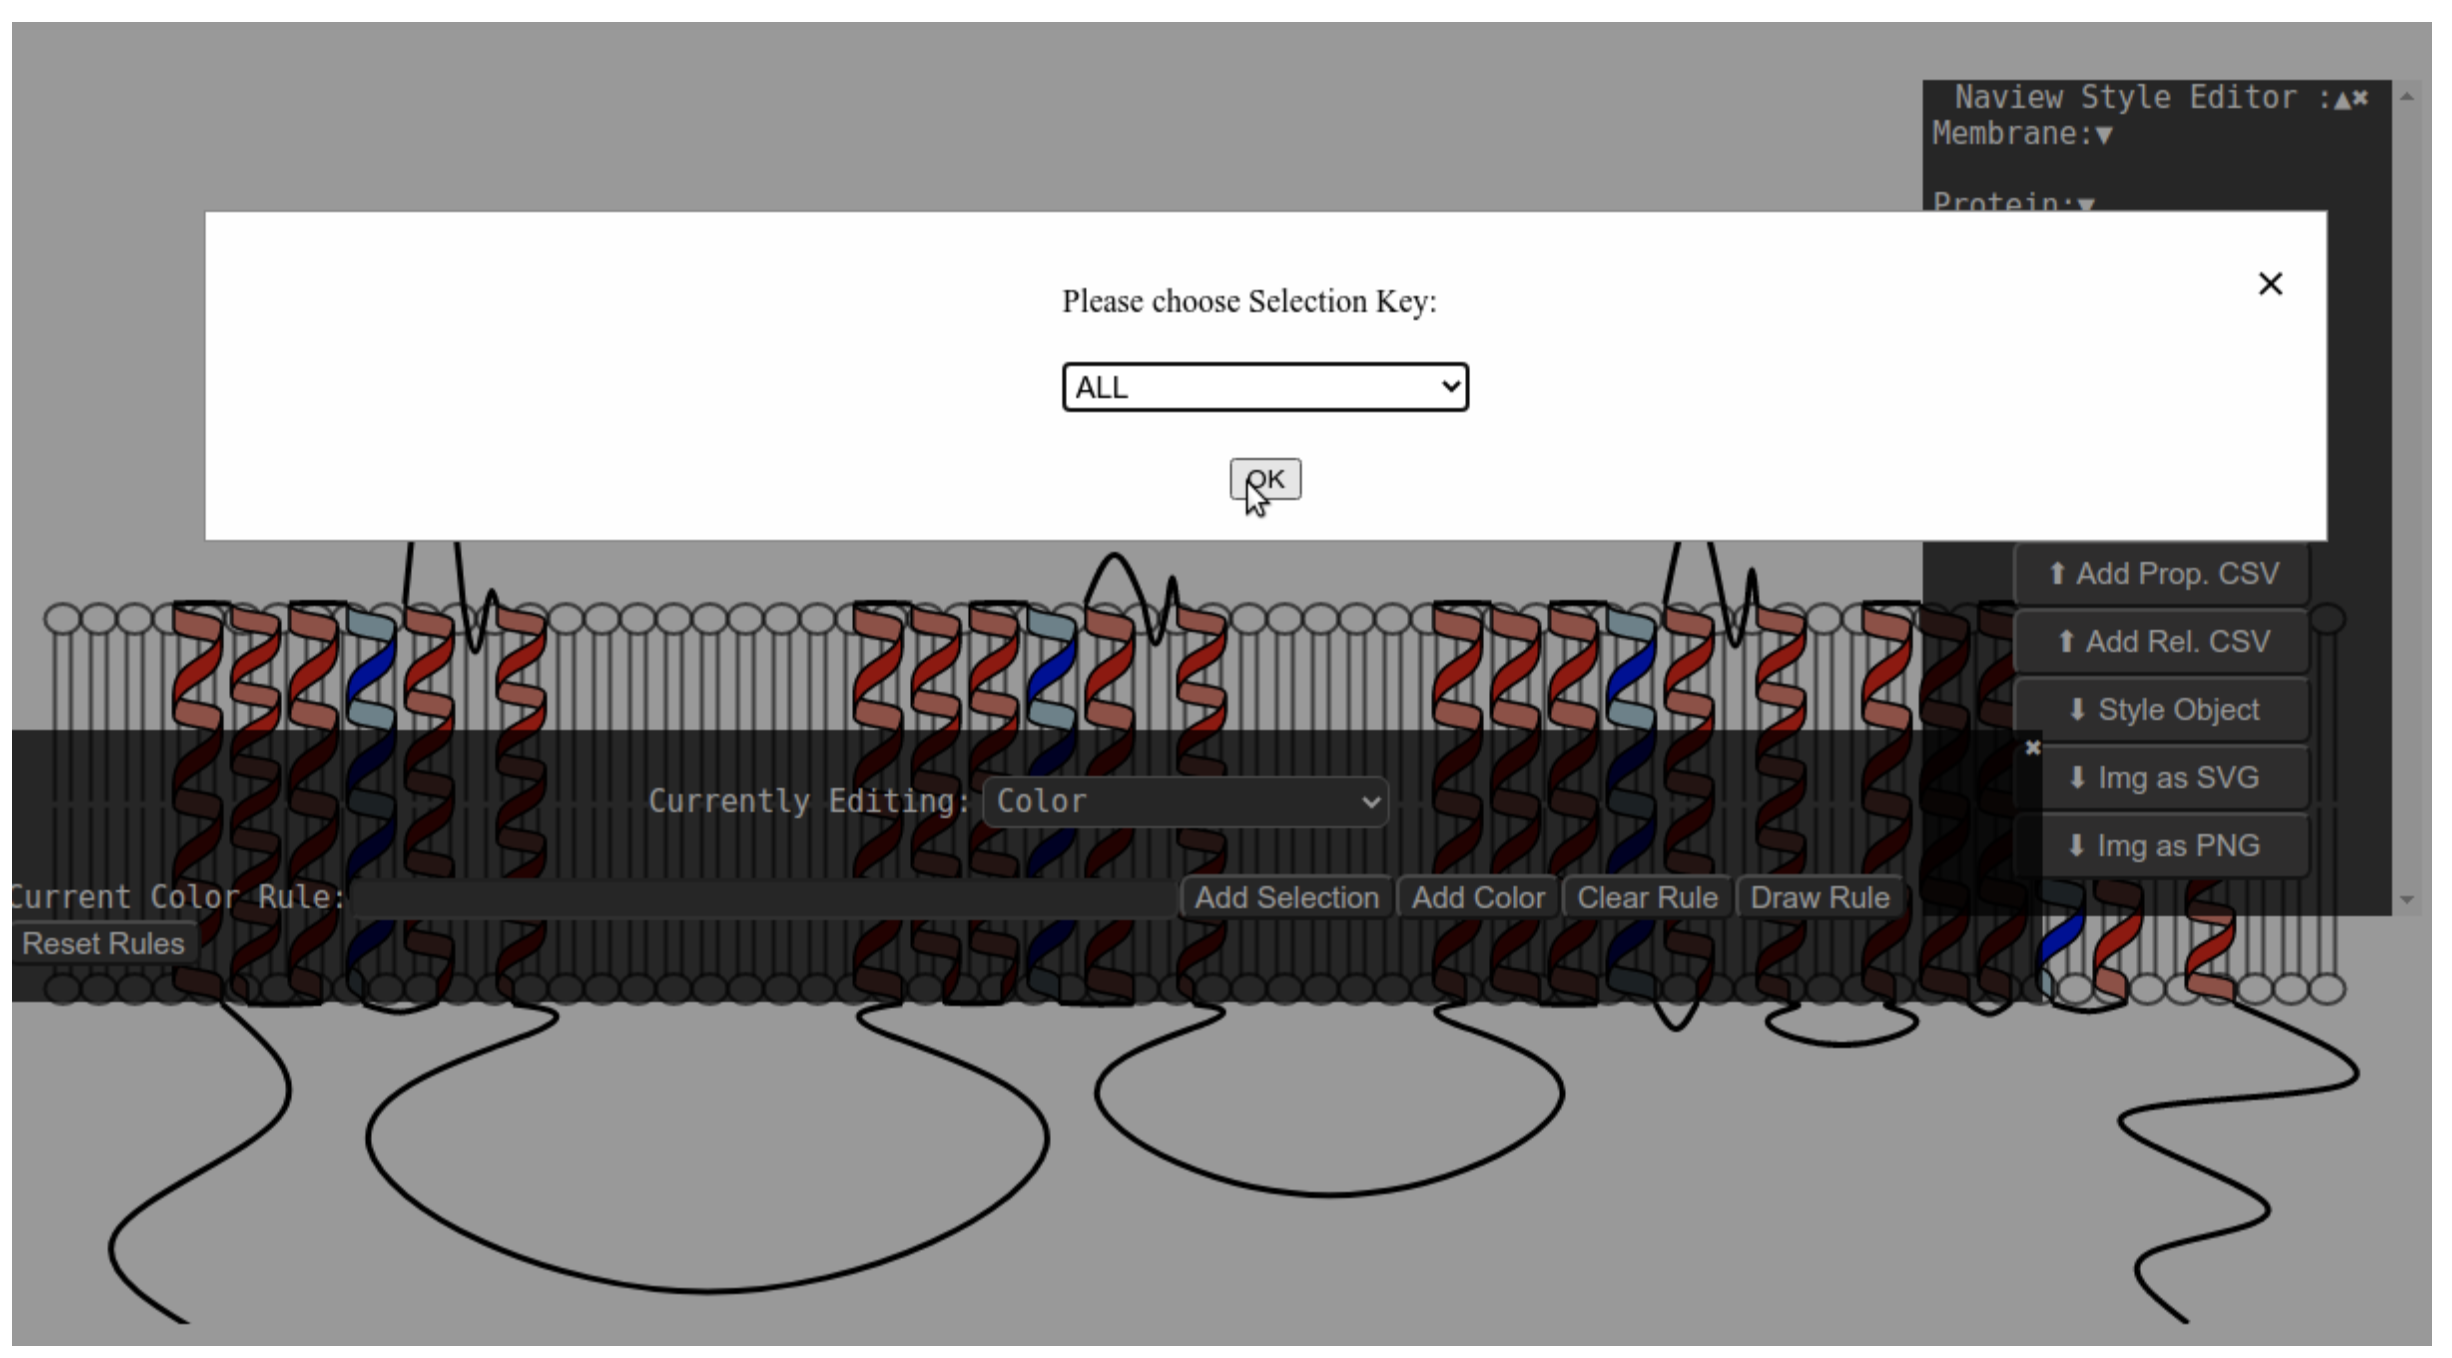
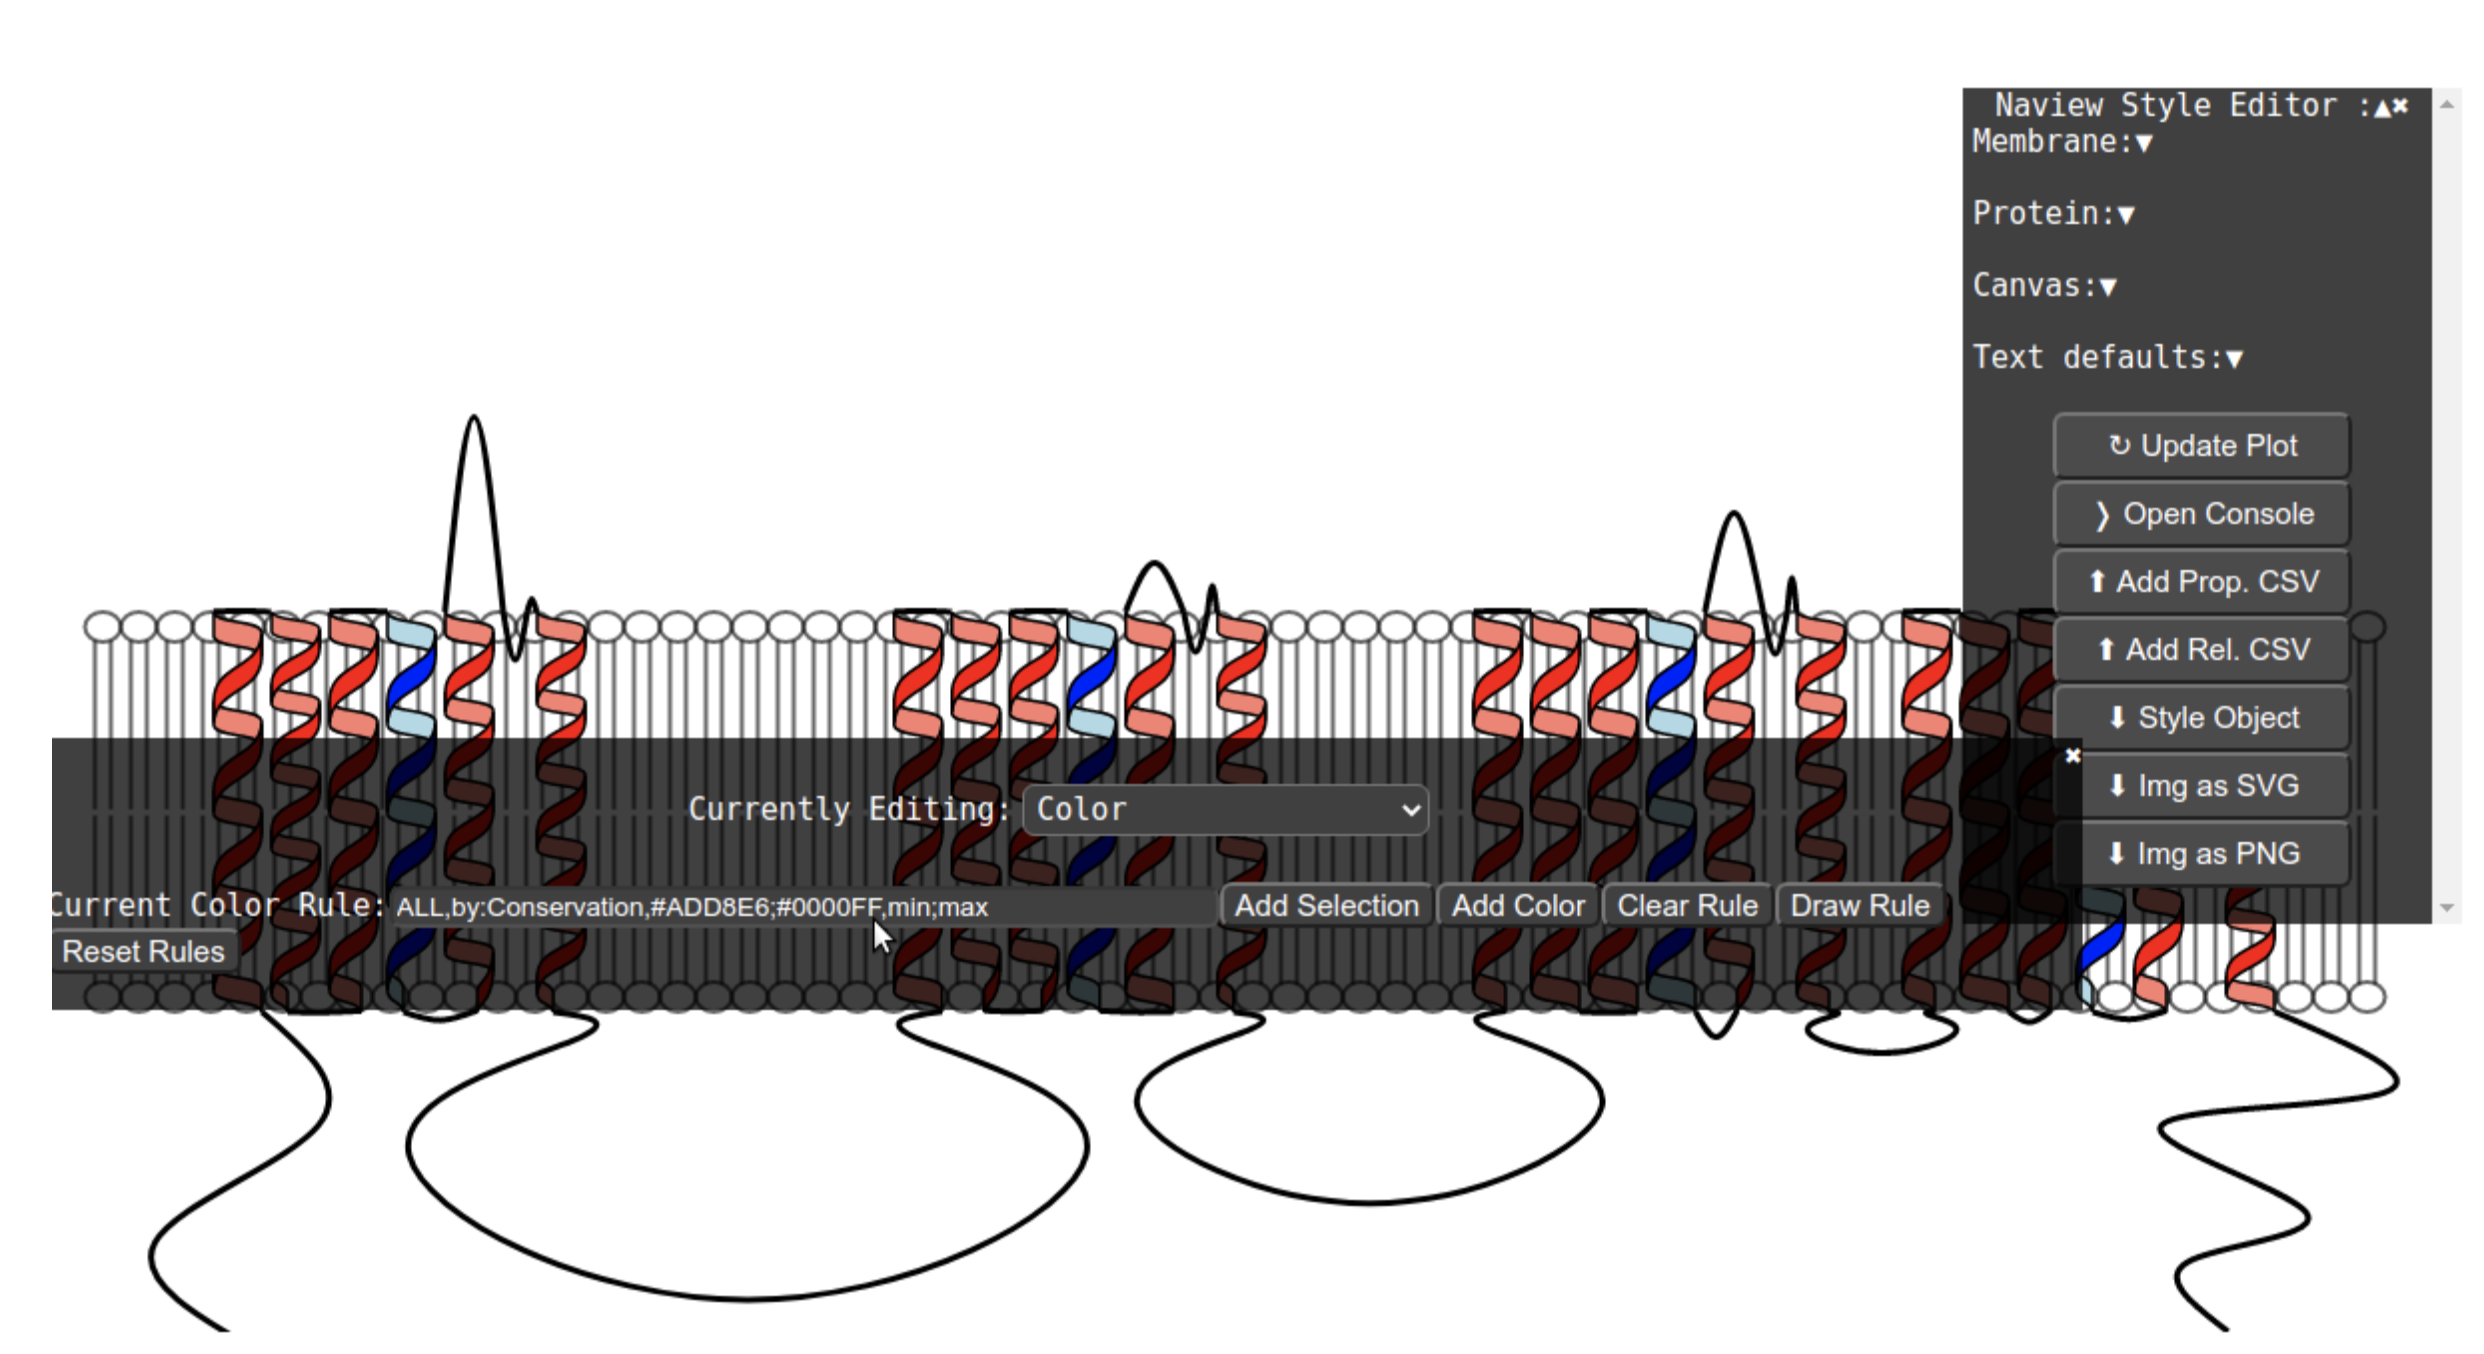
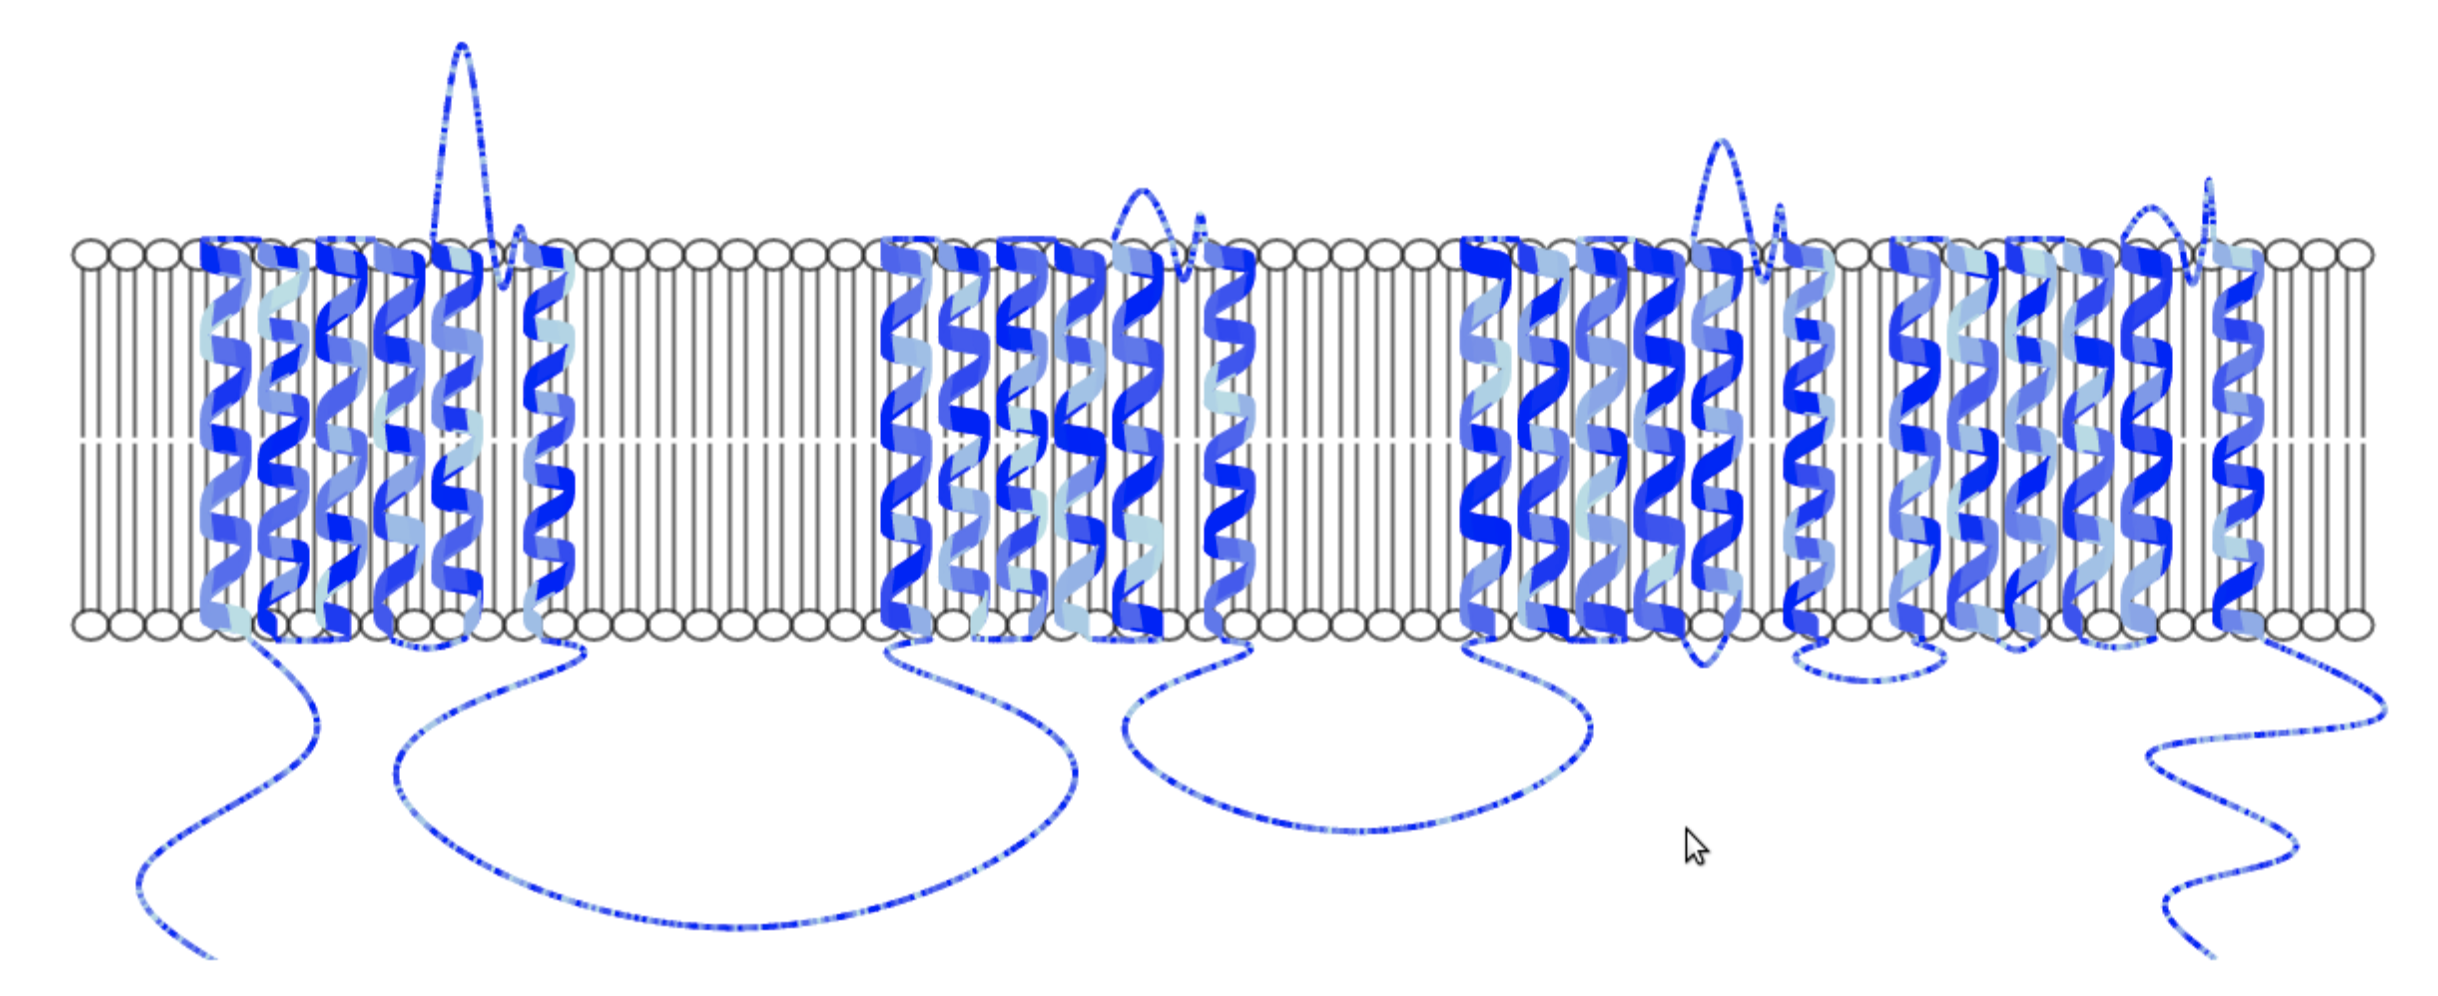
Coloring syntax
Coloring rules can be set as a list of strings JSON Object in a manner similar to the text annotation and drawing styles object. Accepted coloring rule string follow the syntax:
“Residue/element selector”, “Color/Color rule”Combined rules can be added by using the “&” character as shown in the examples below:
Additionally, you can see how to add color mapping using the style editor here.
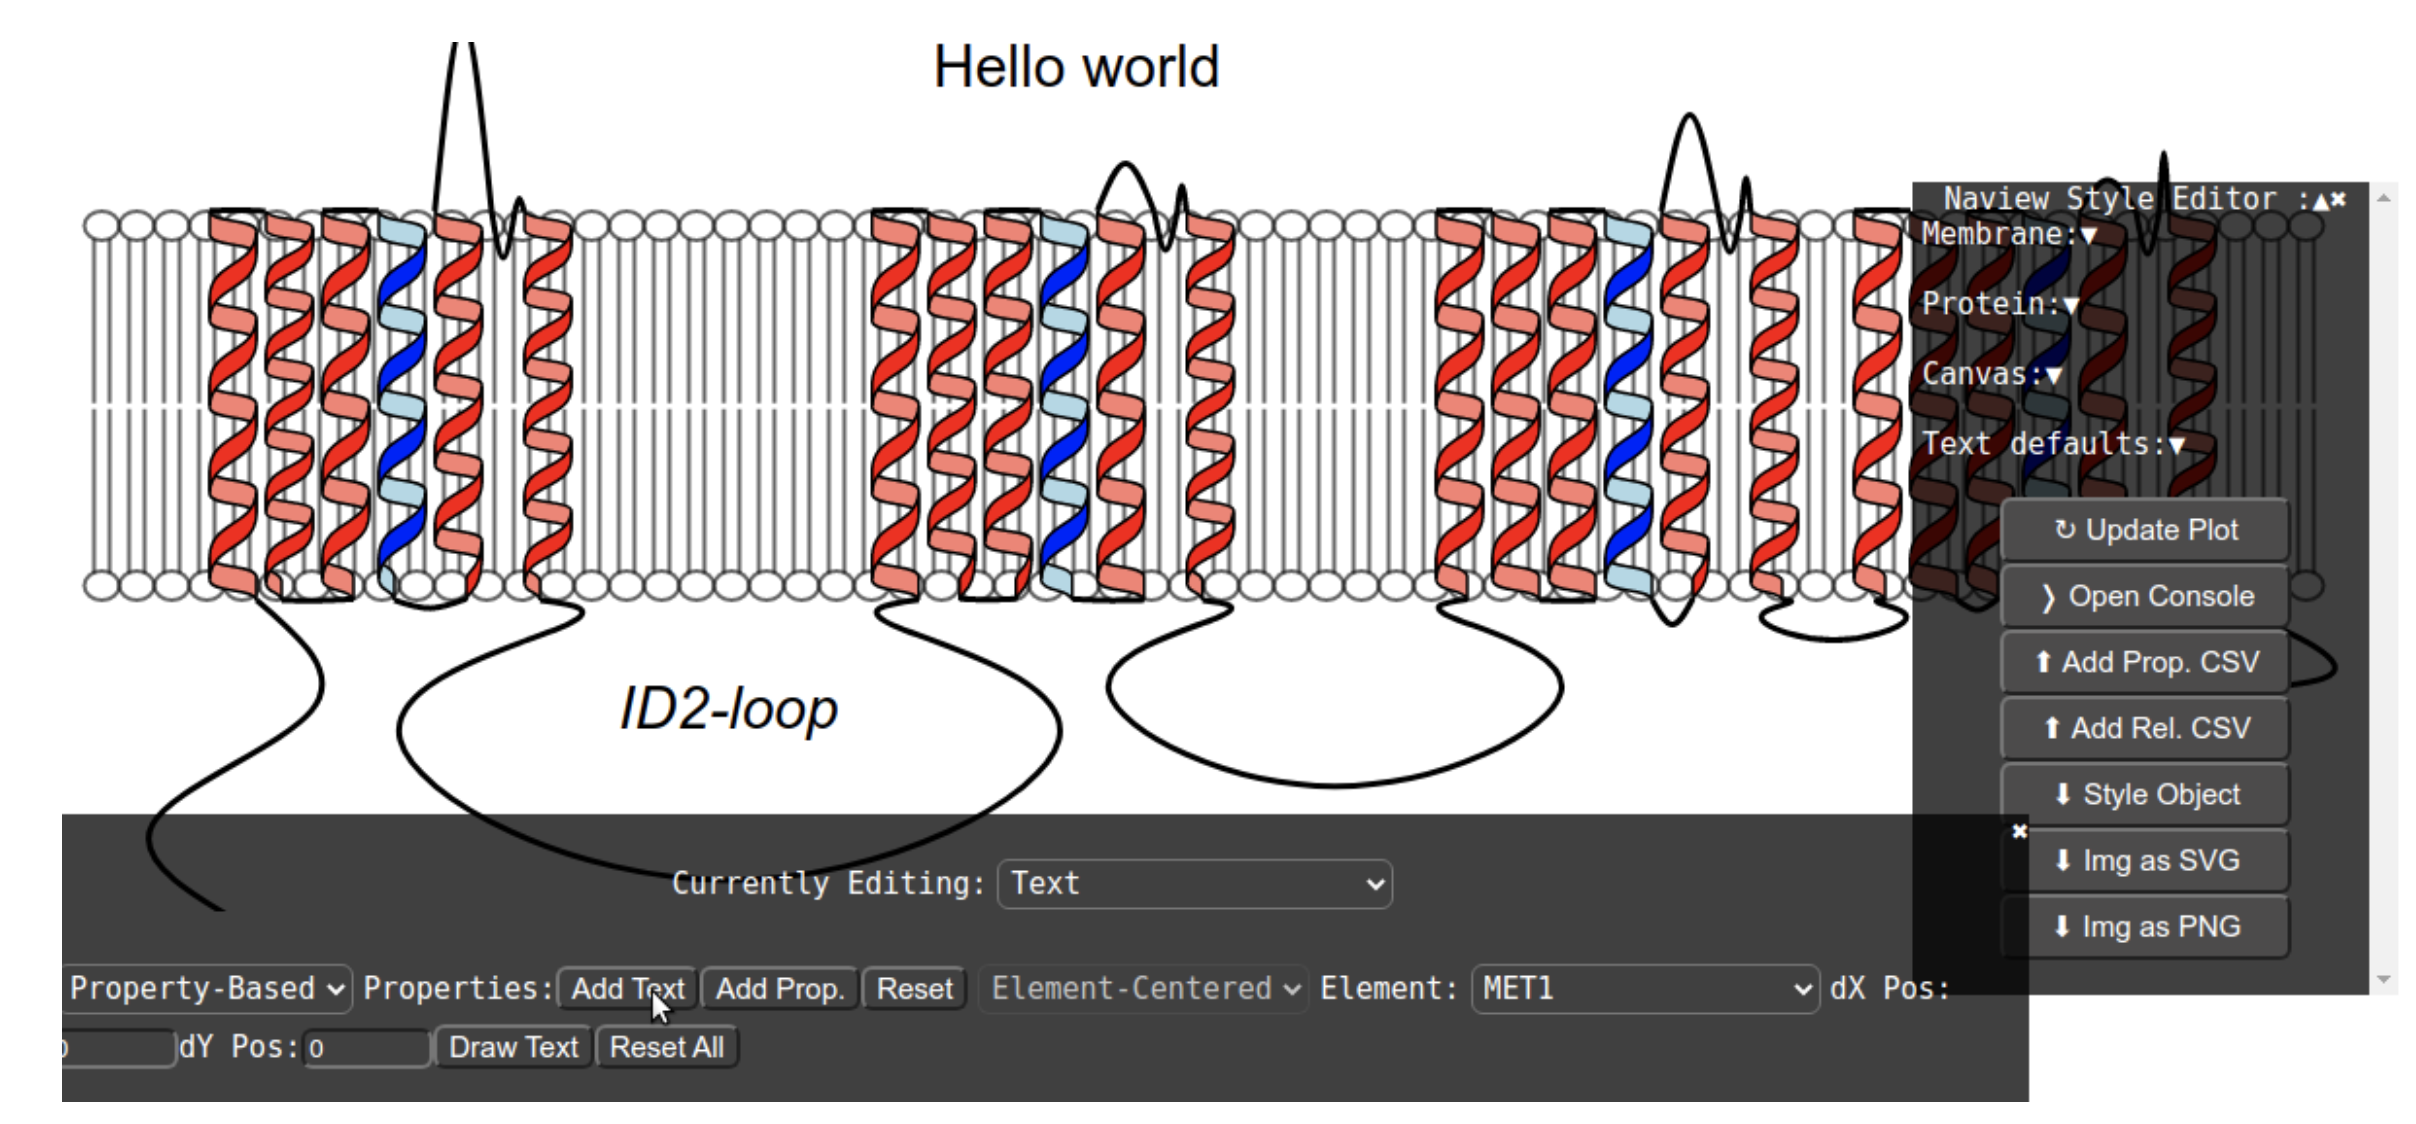
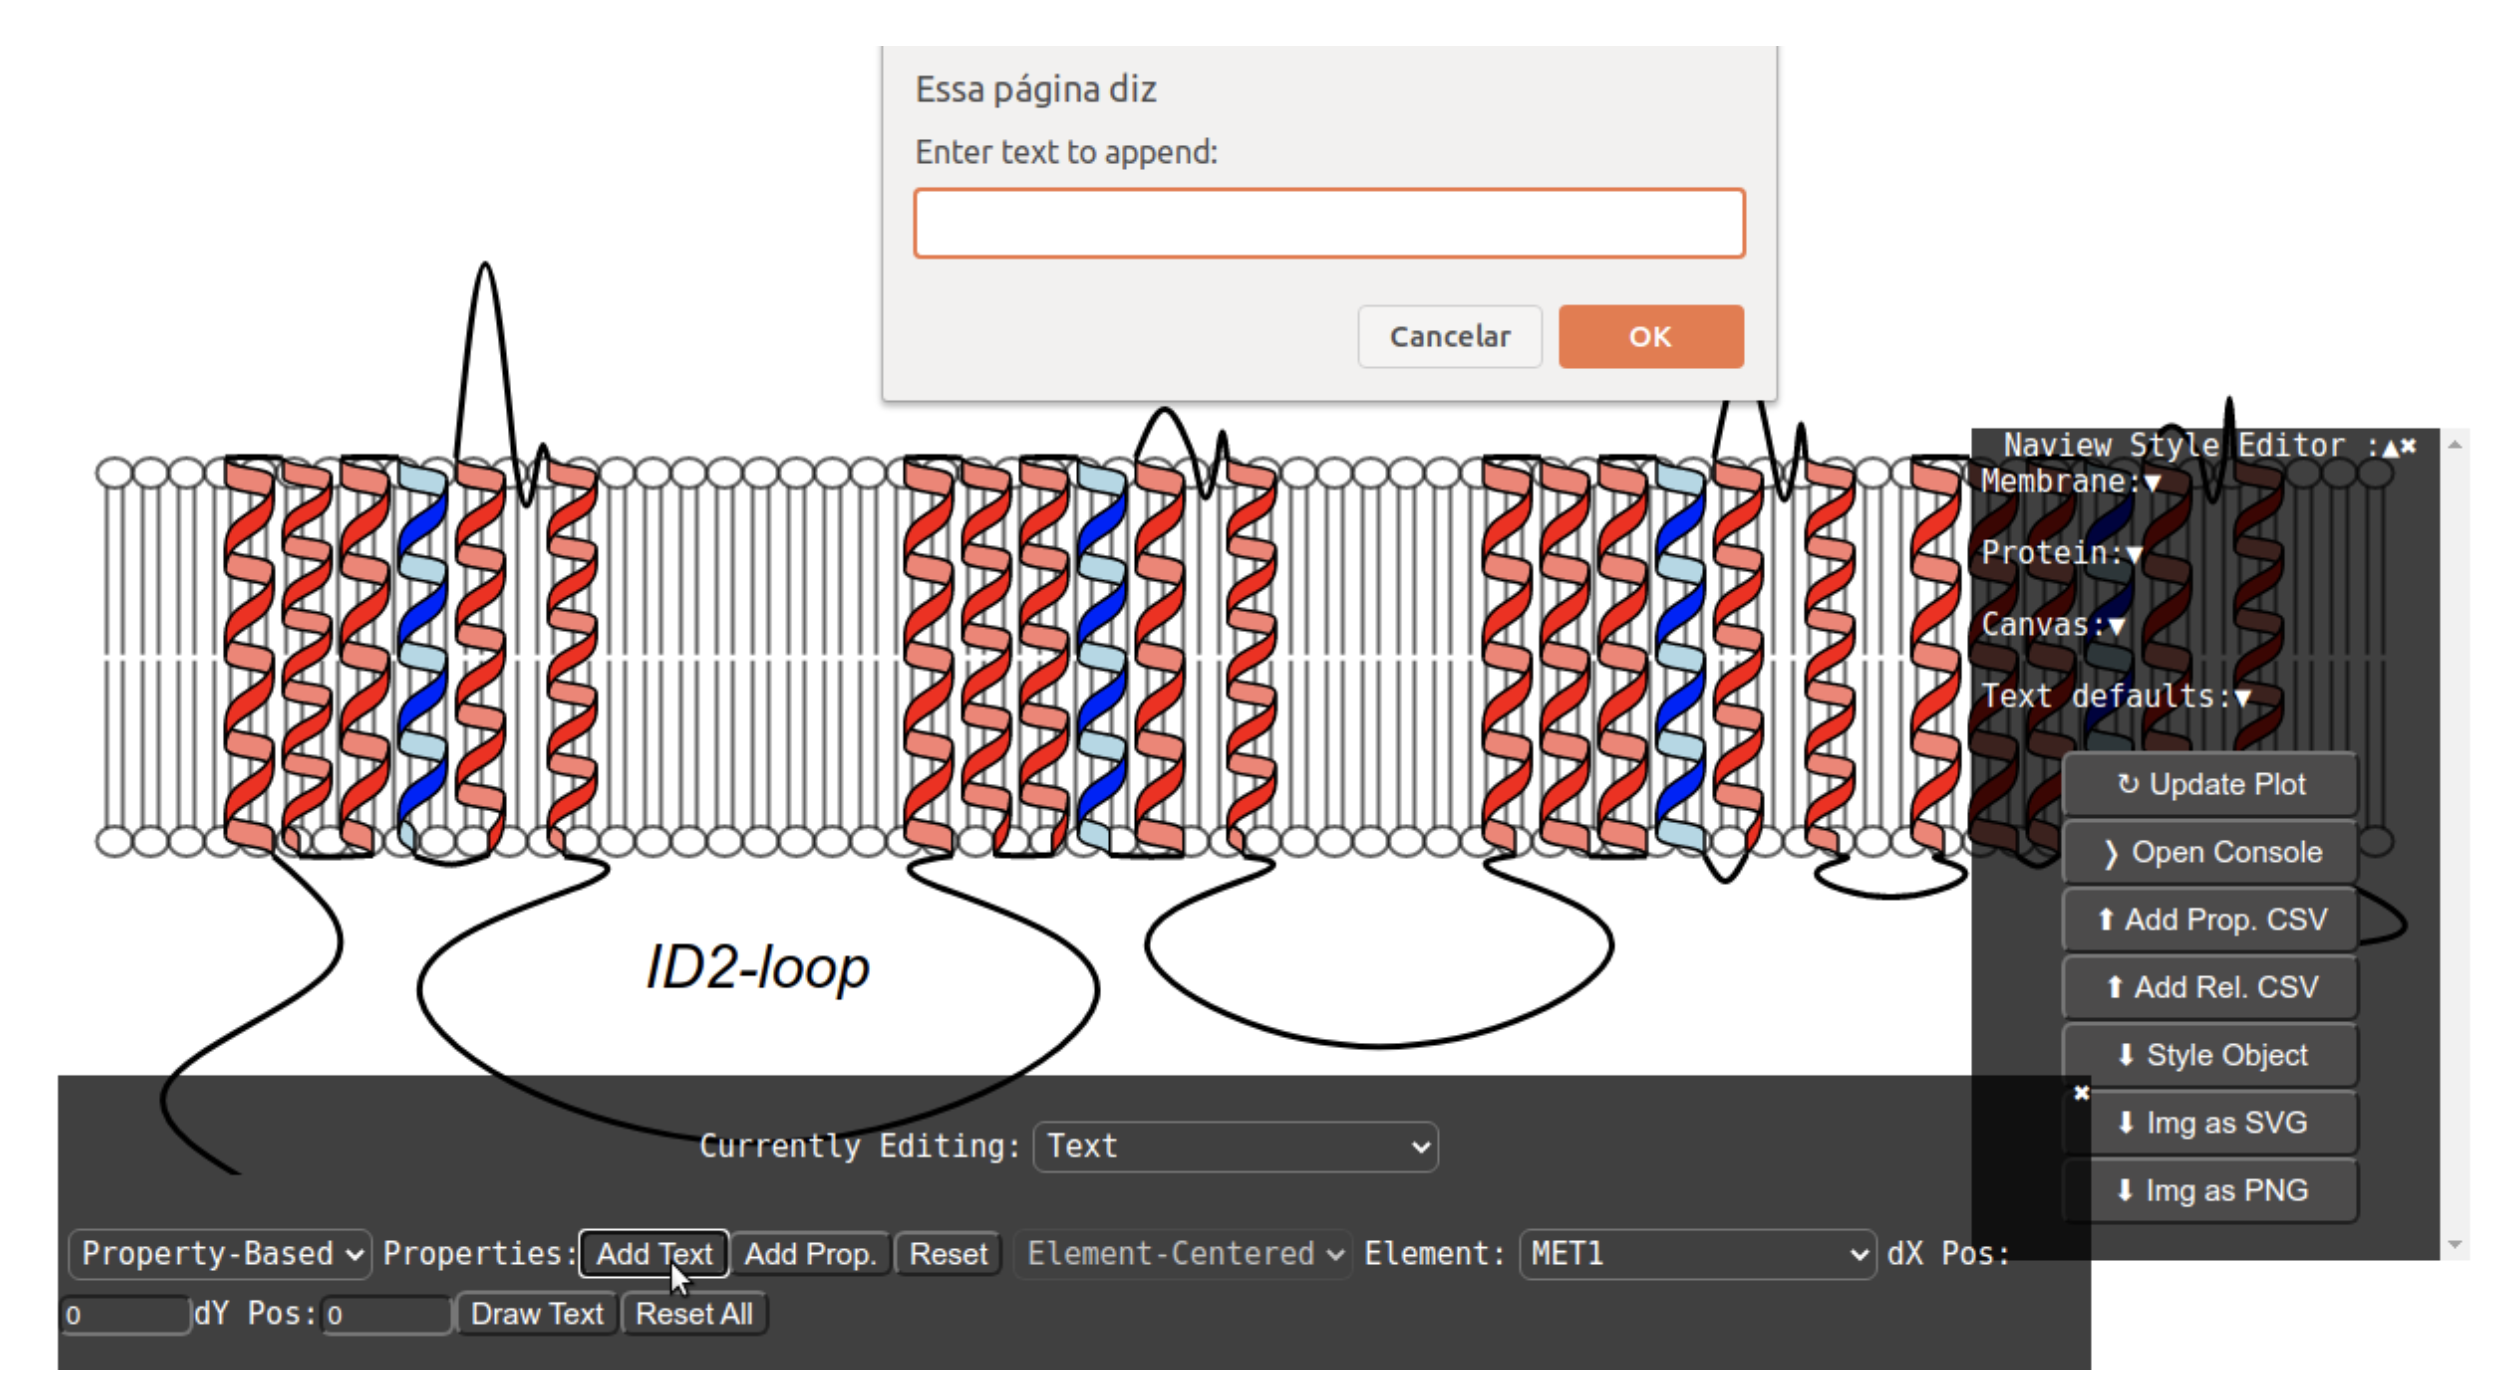
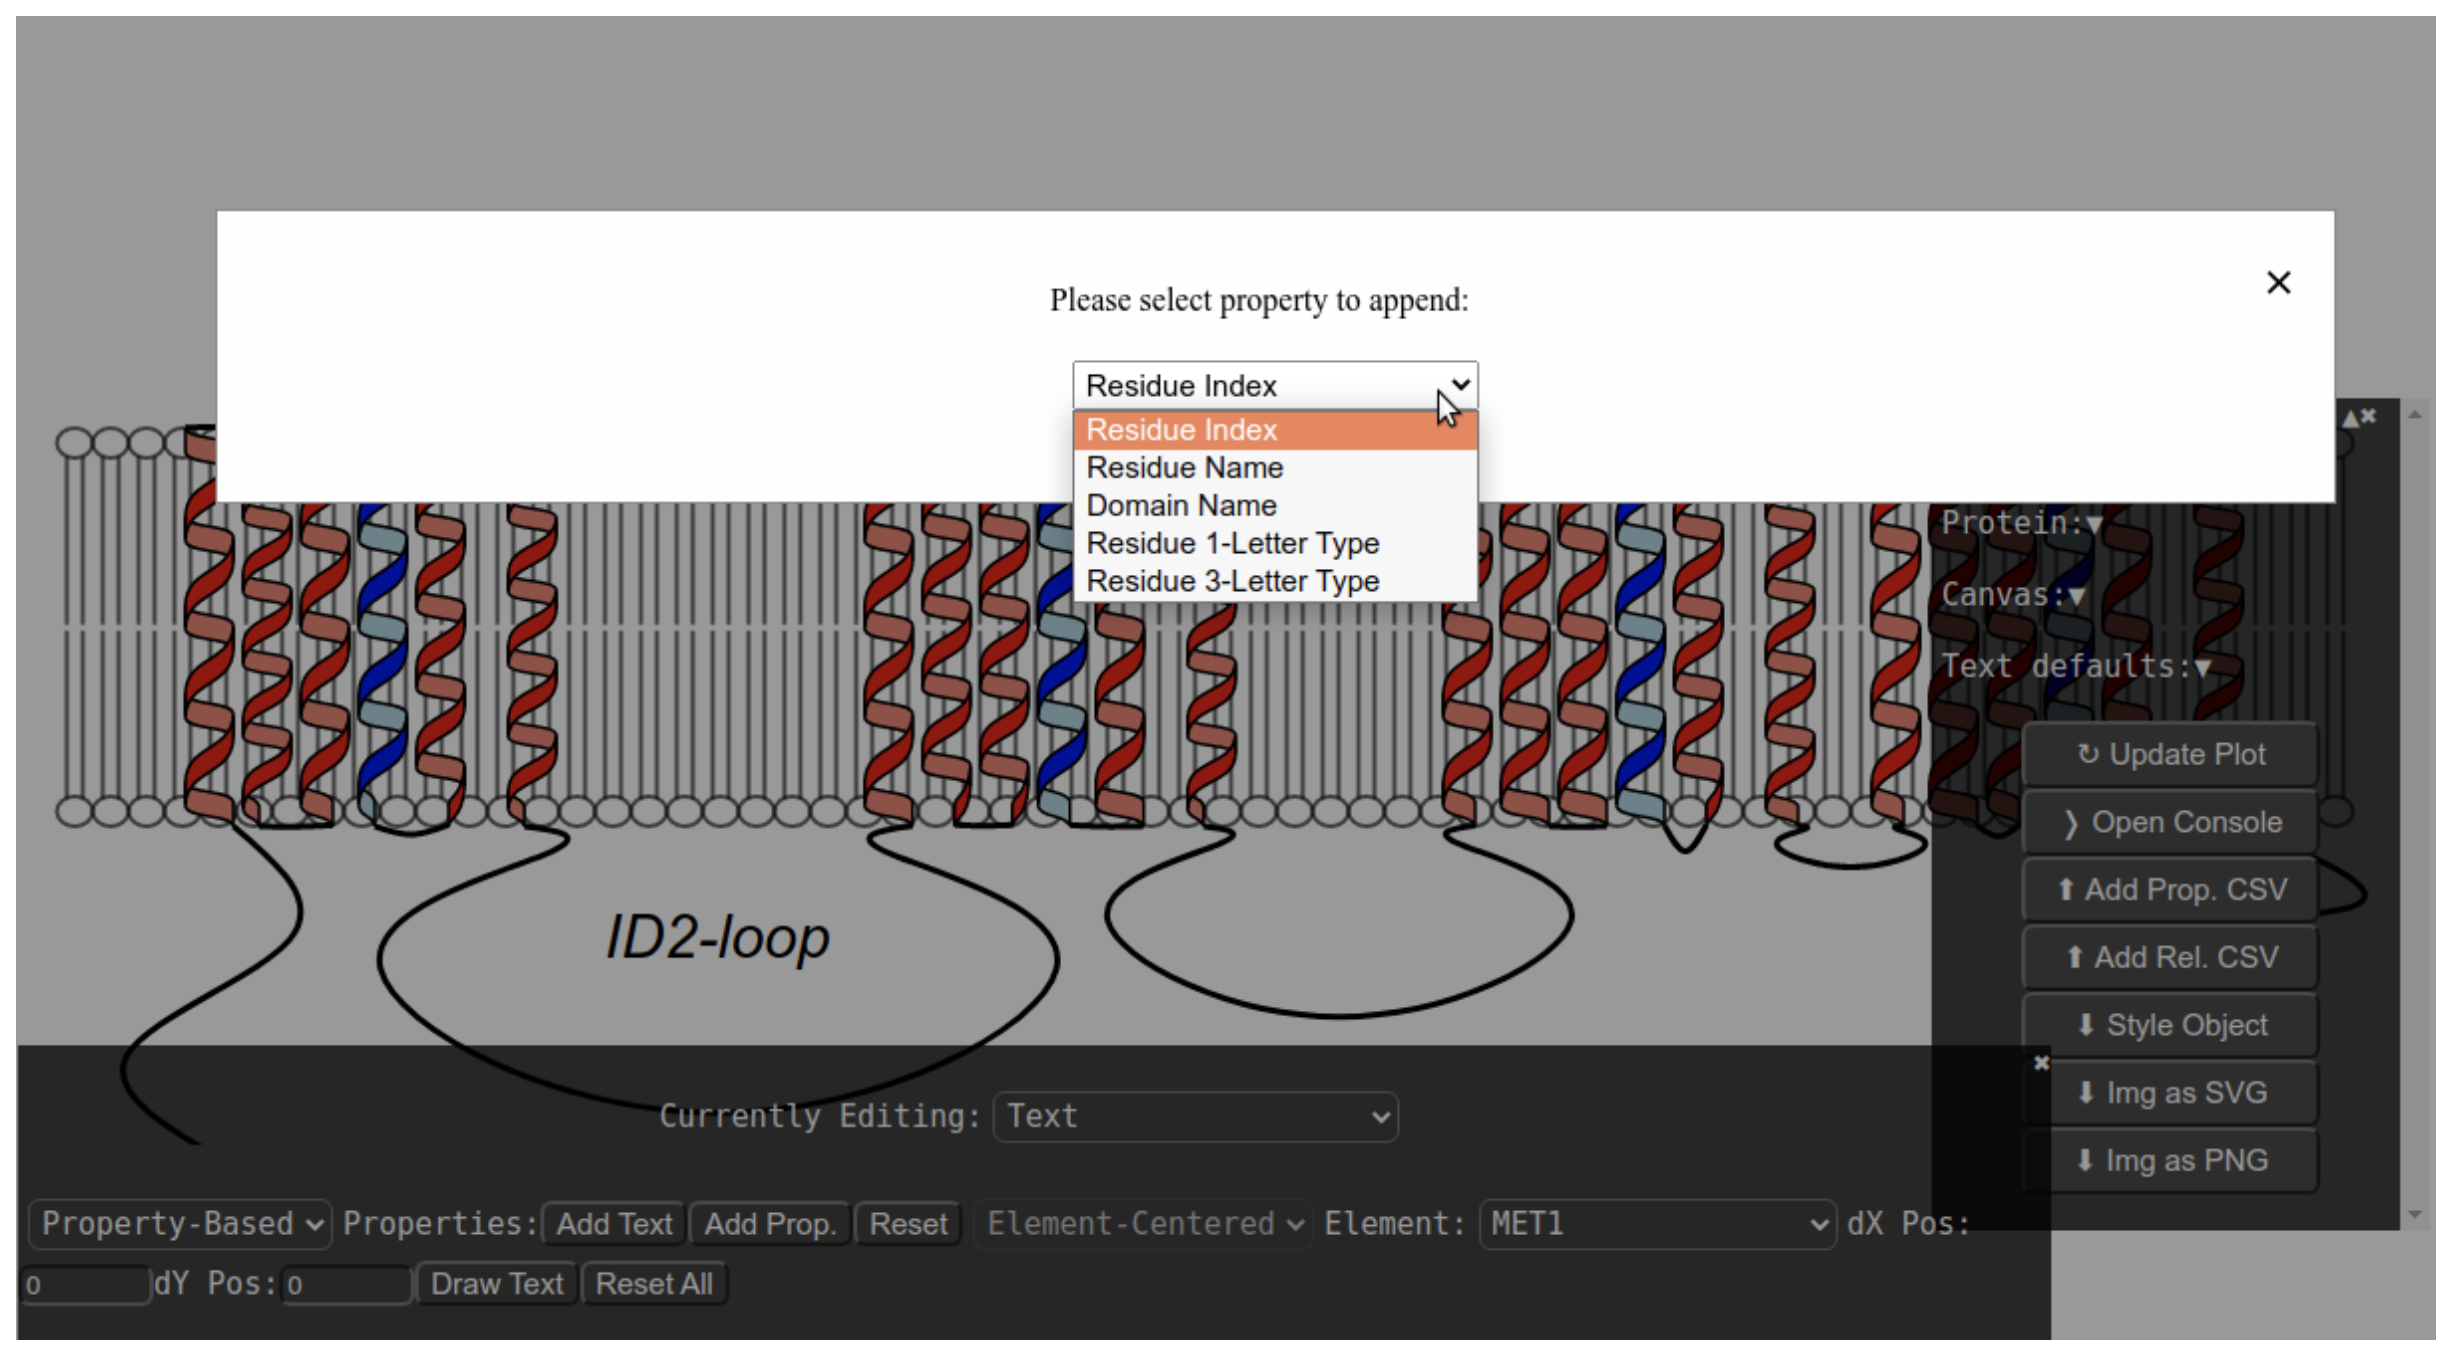
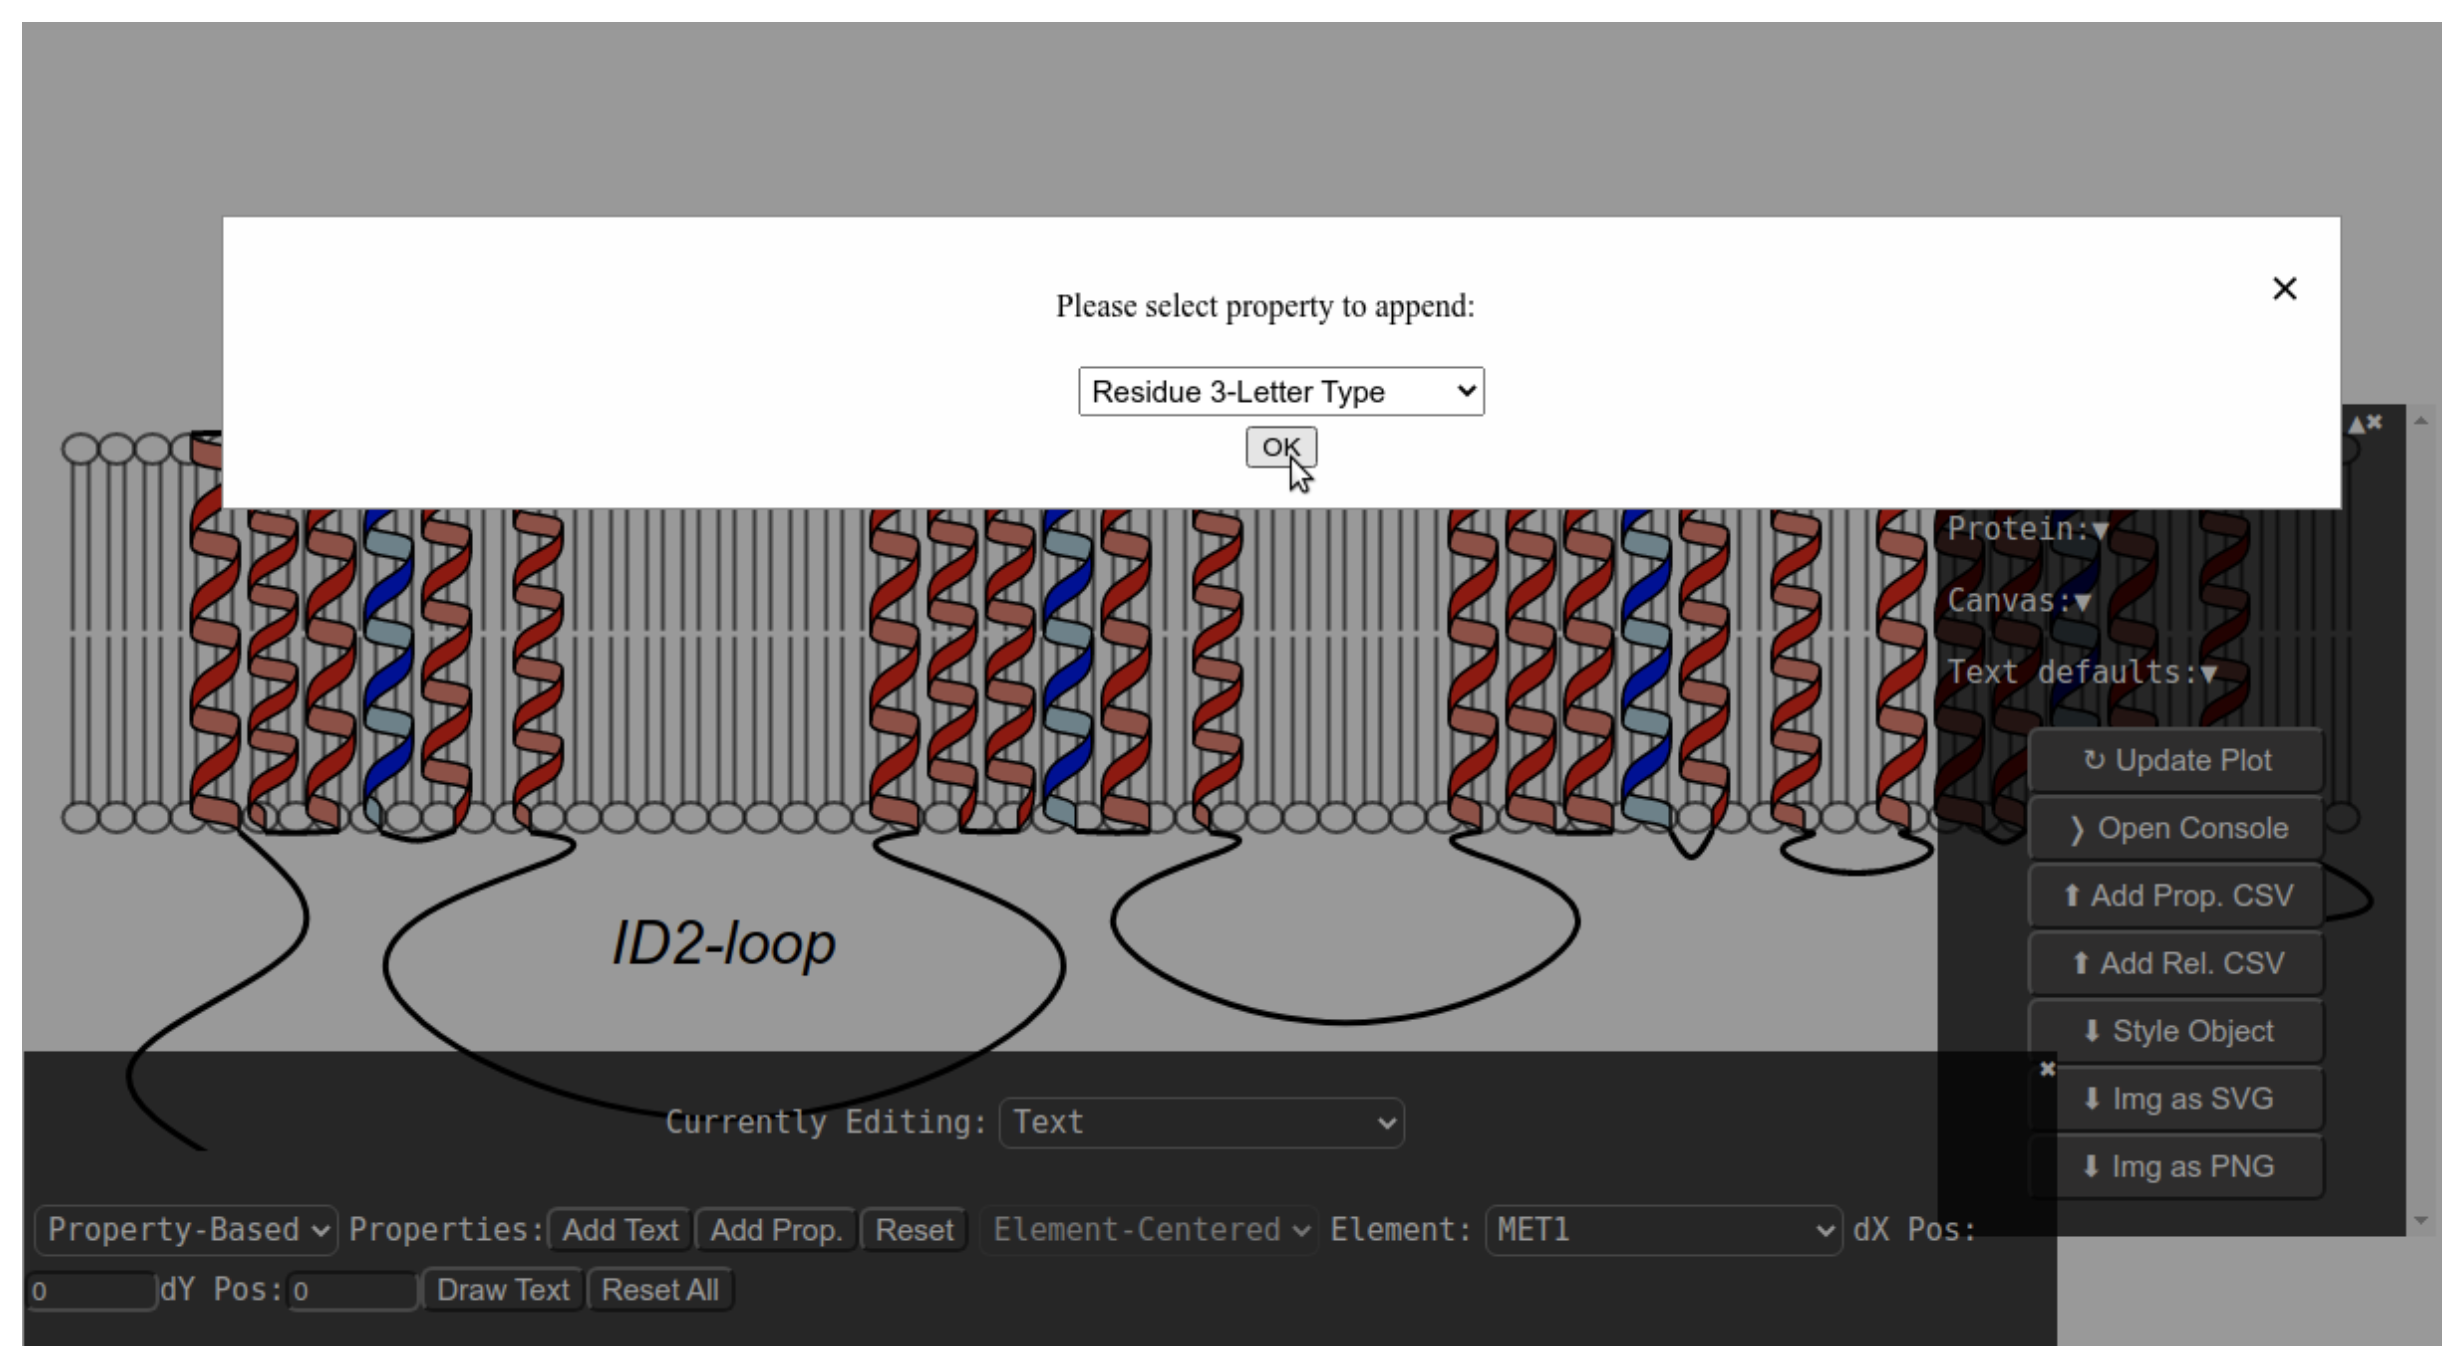
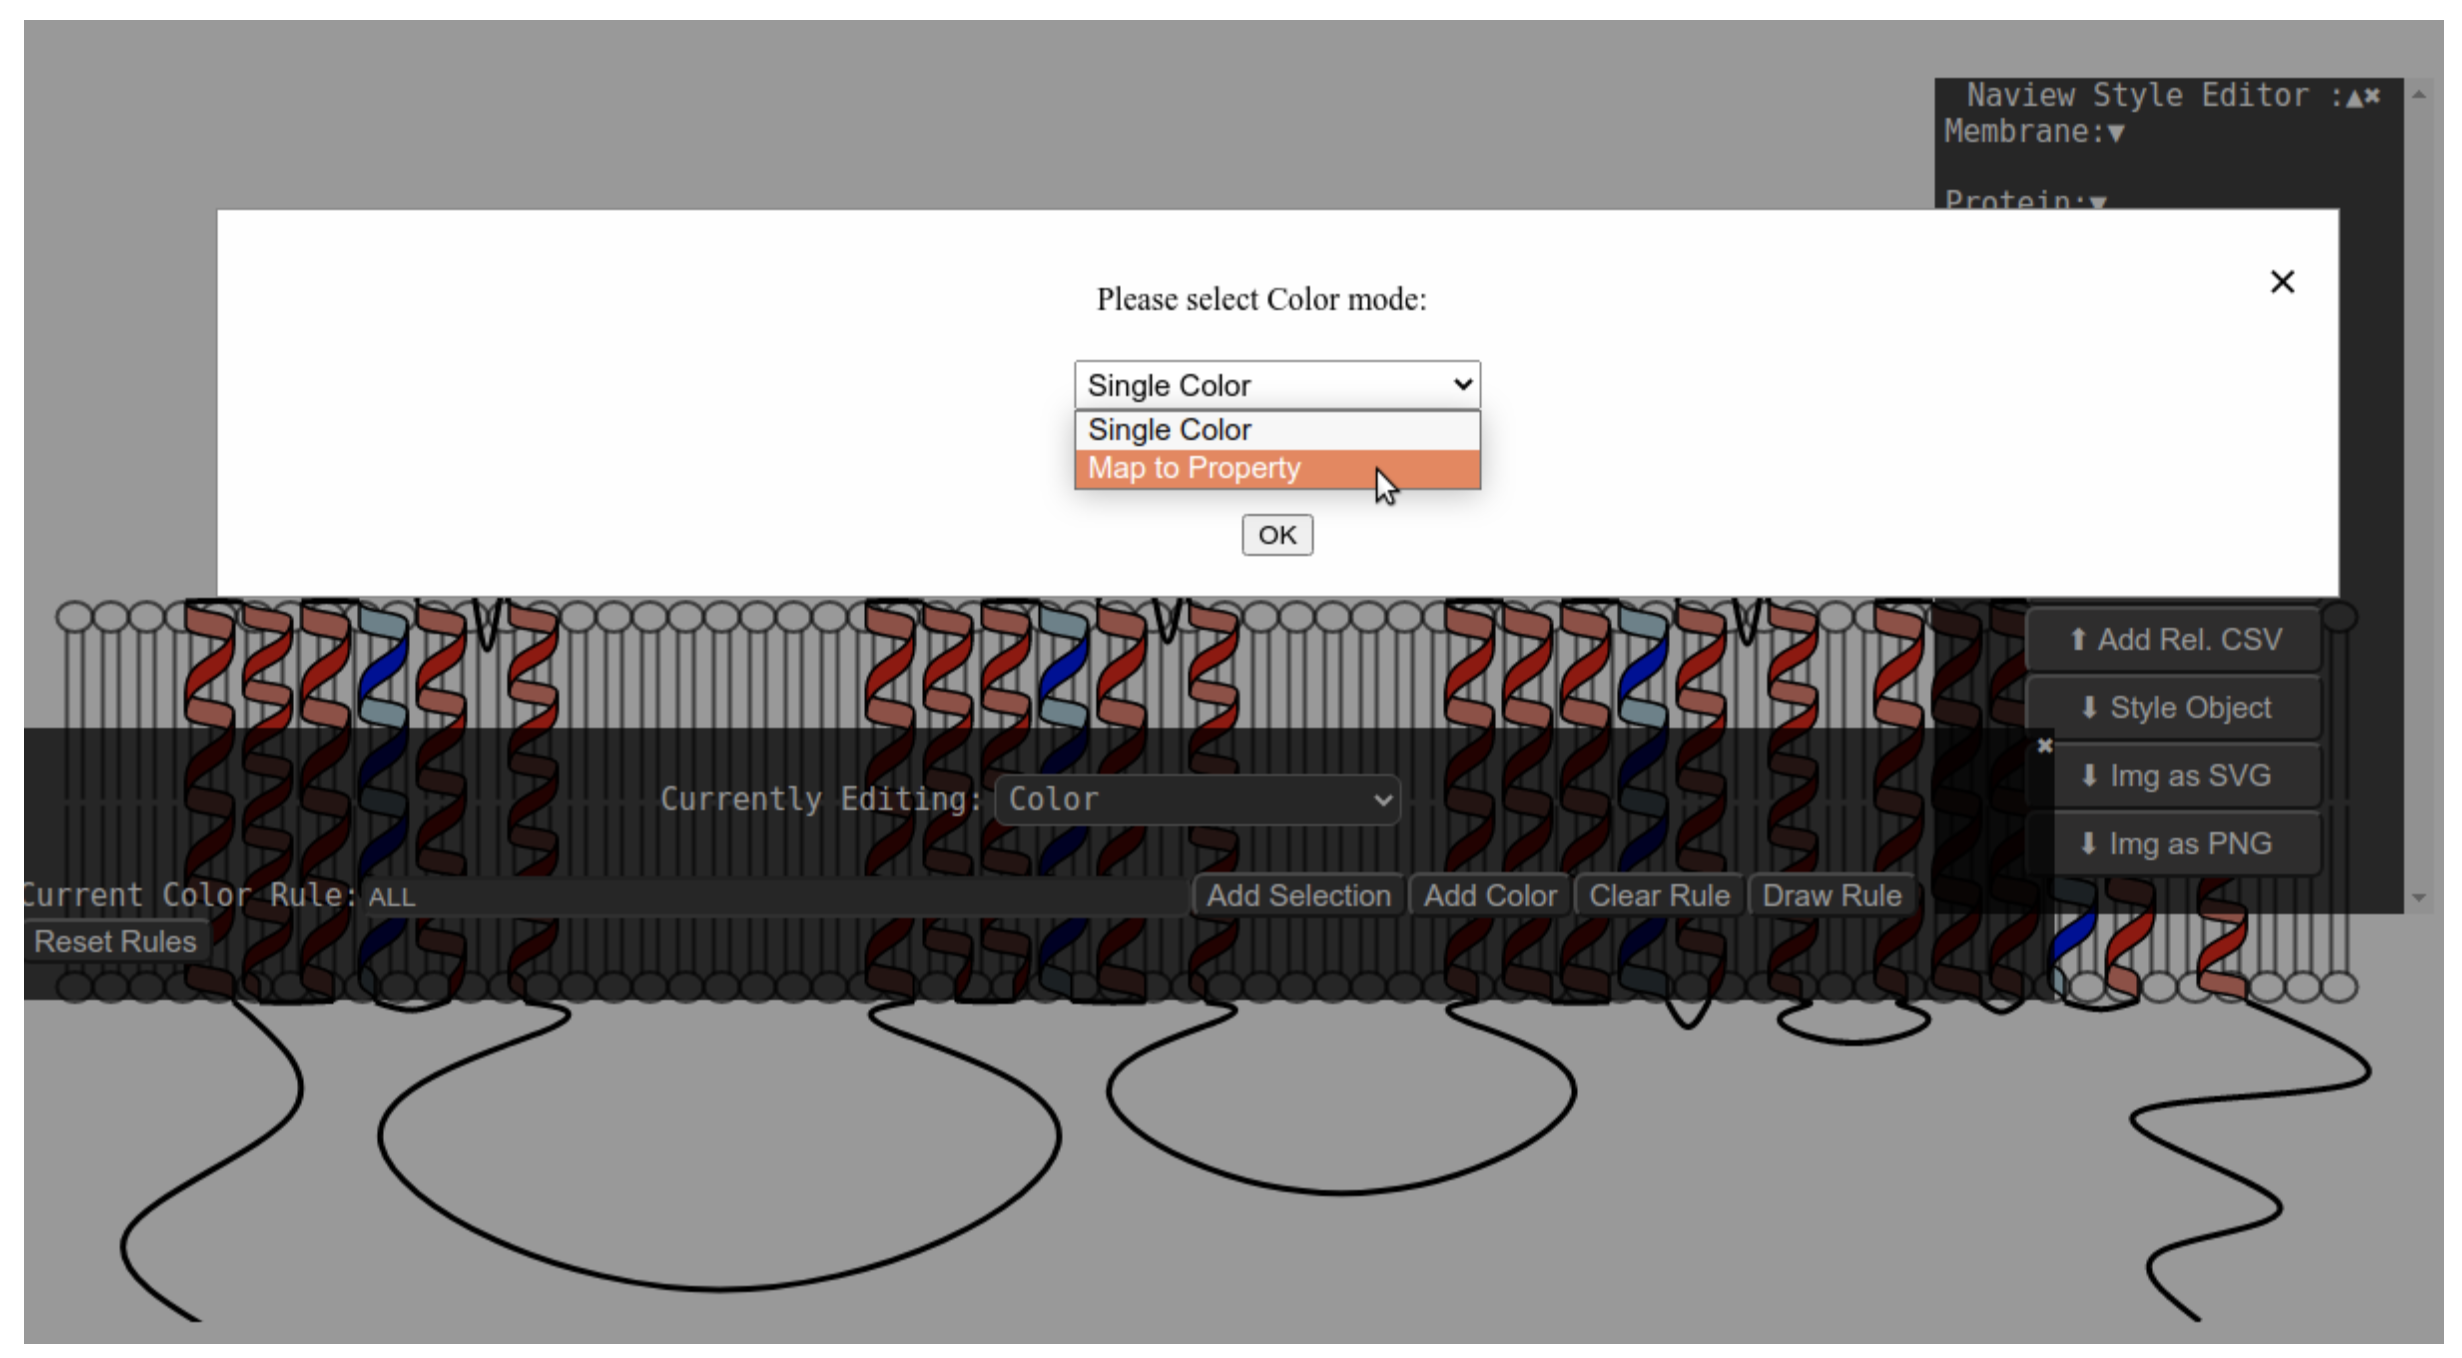
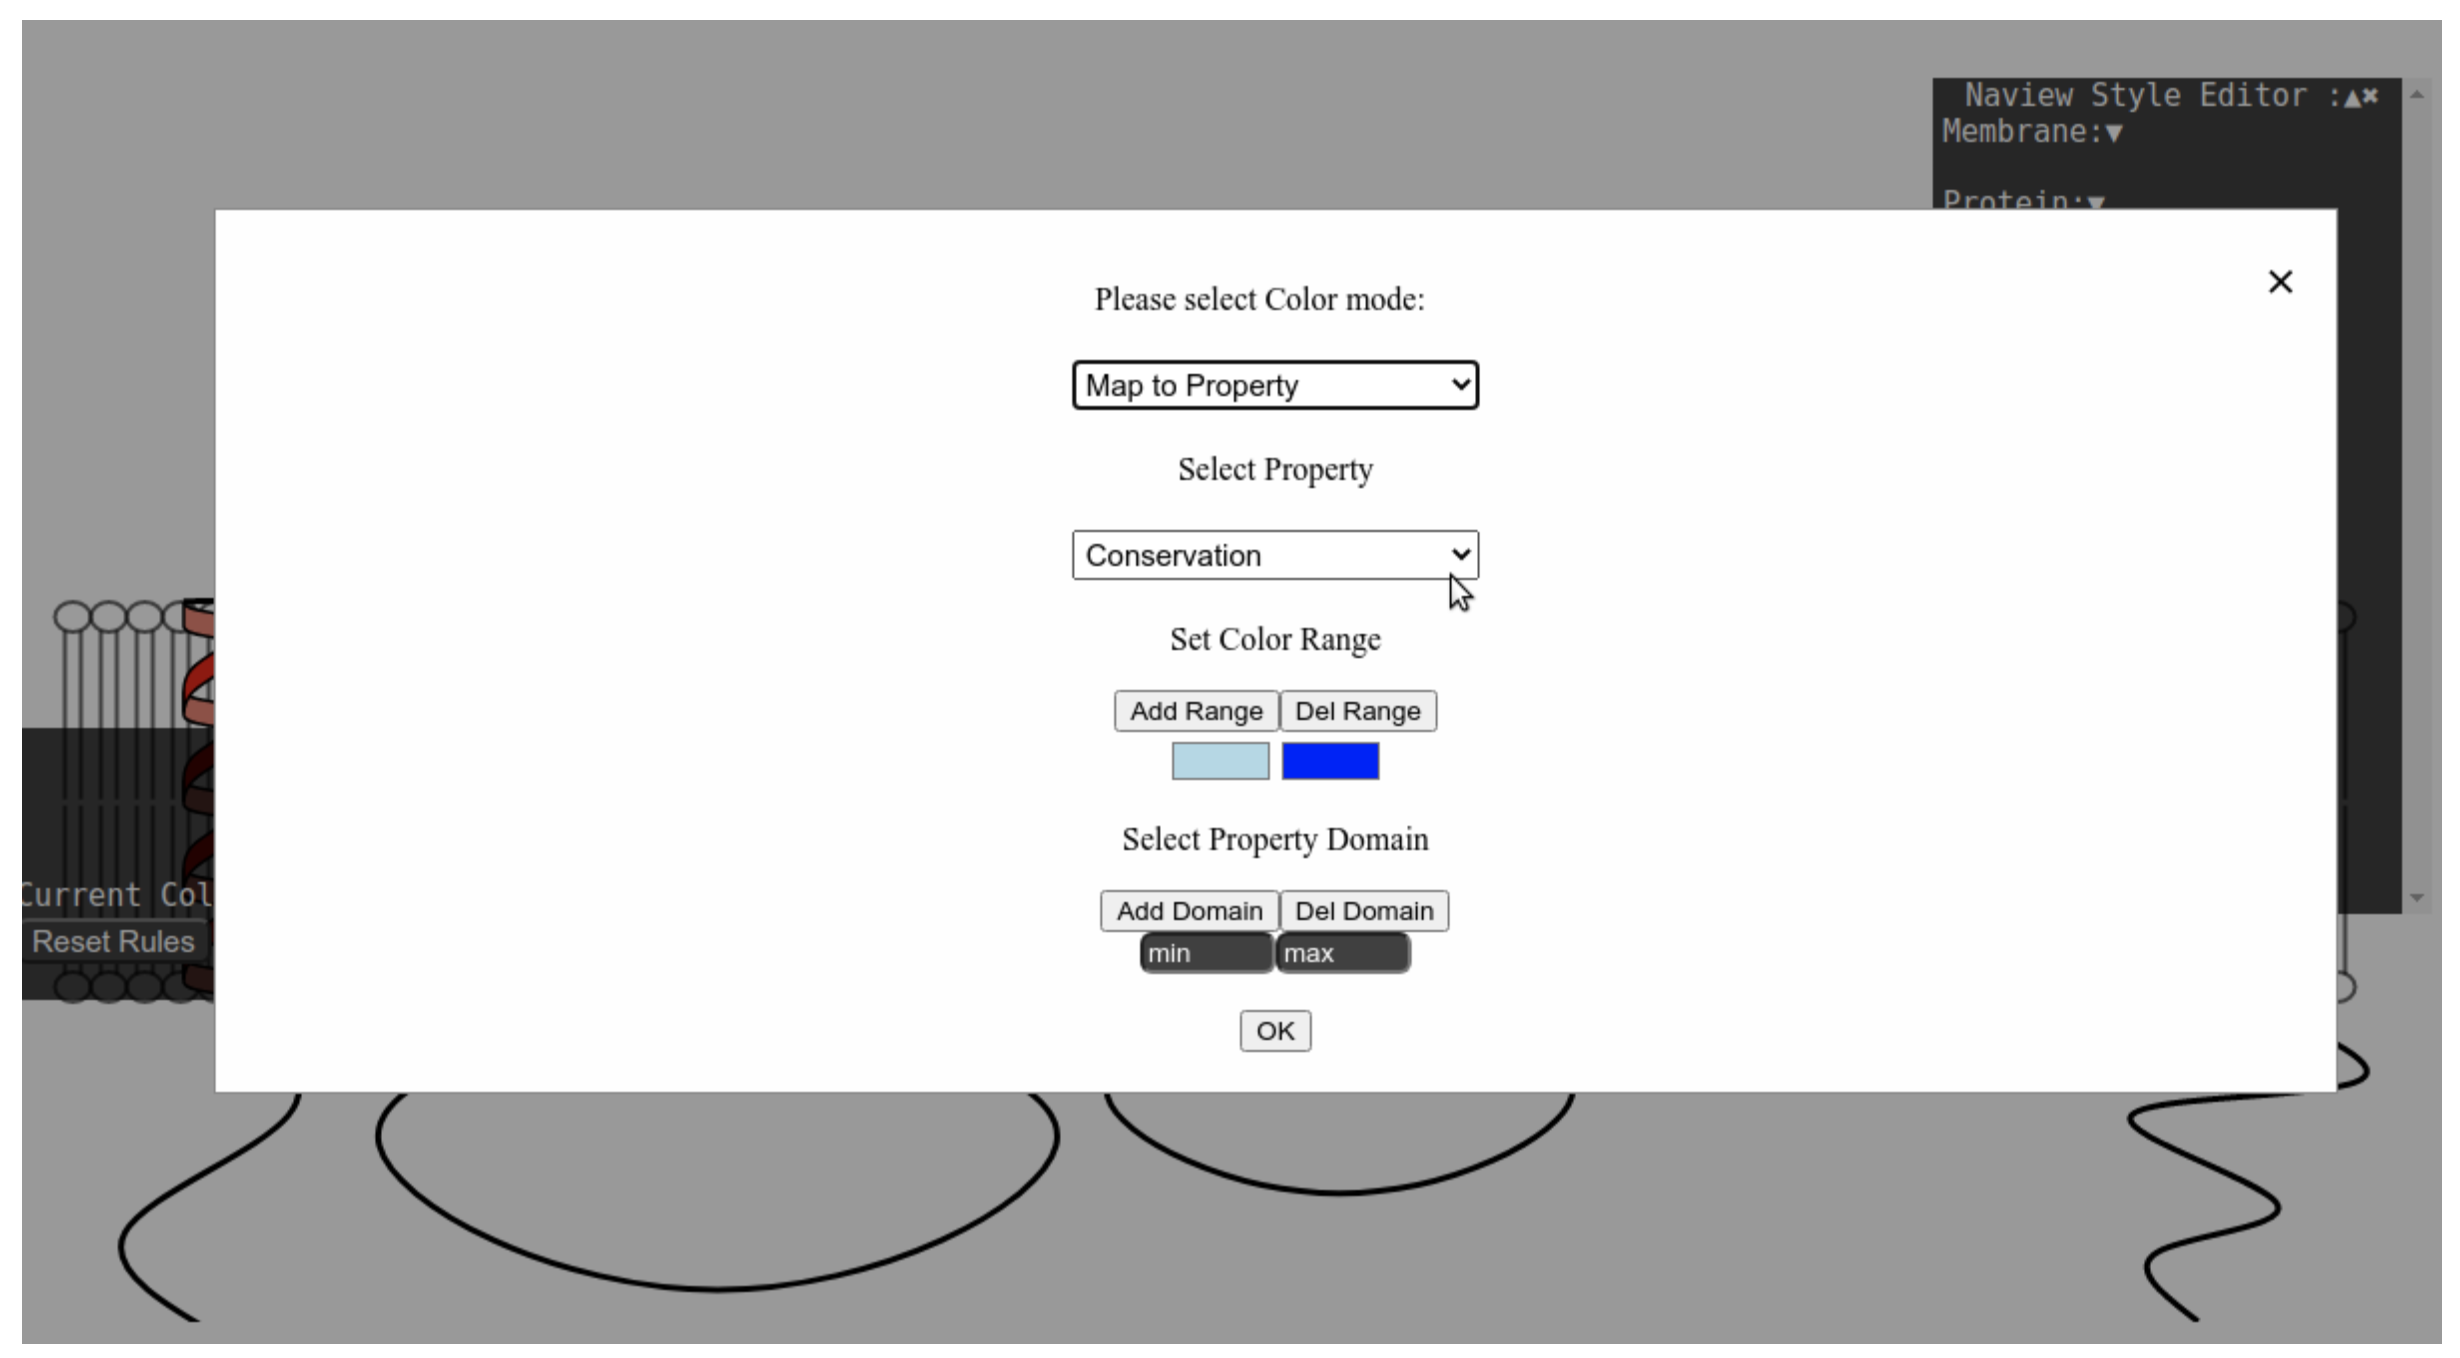
Map to property
Residue-properties can also be included as a JSON formatted object (or CSV when using the Style Editor, tutorial here):
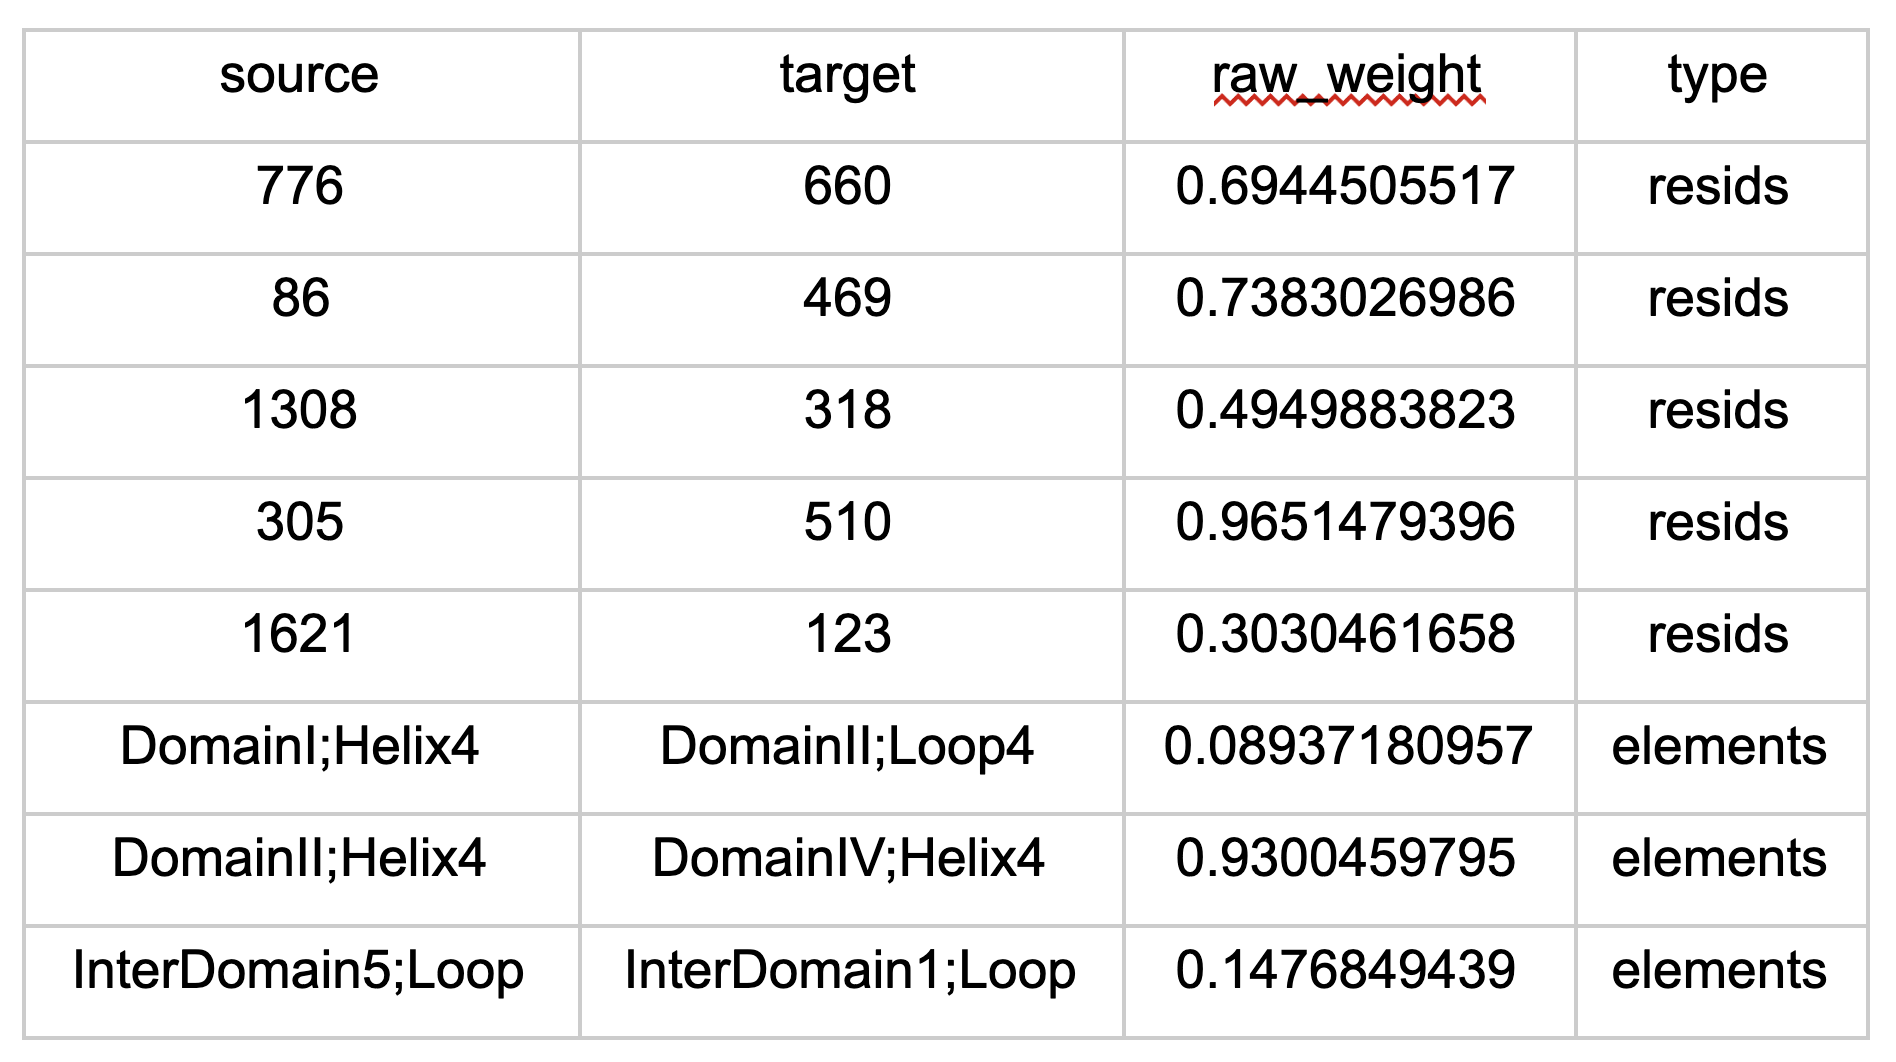
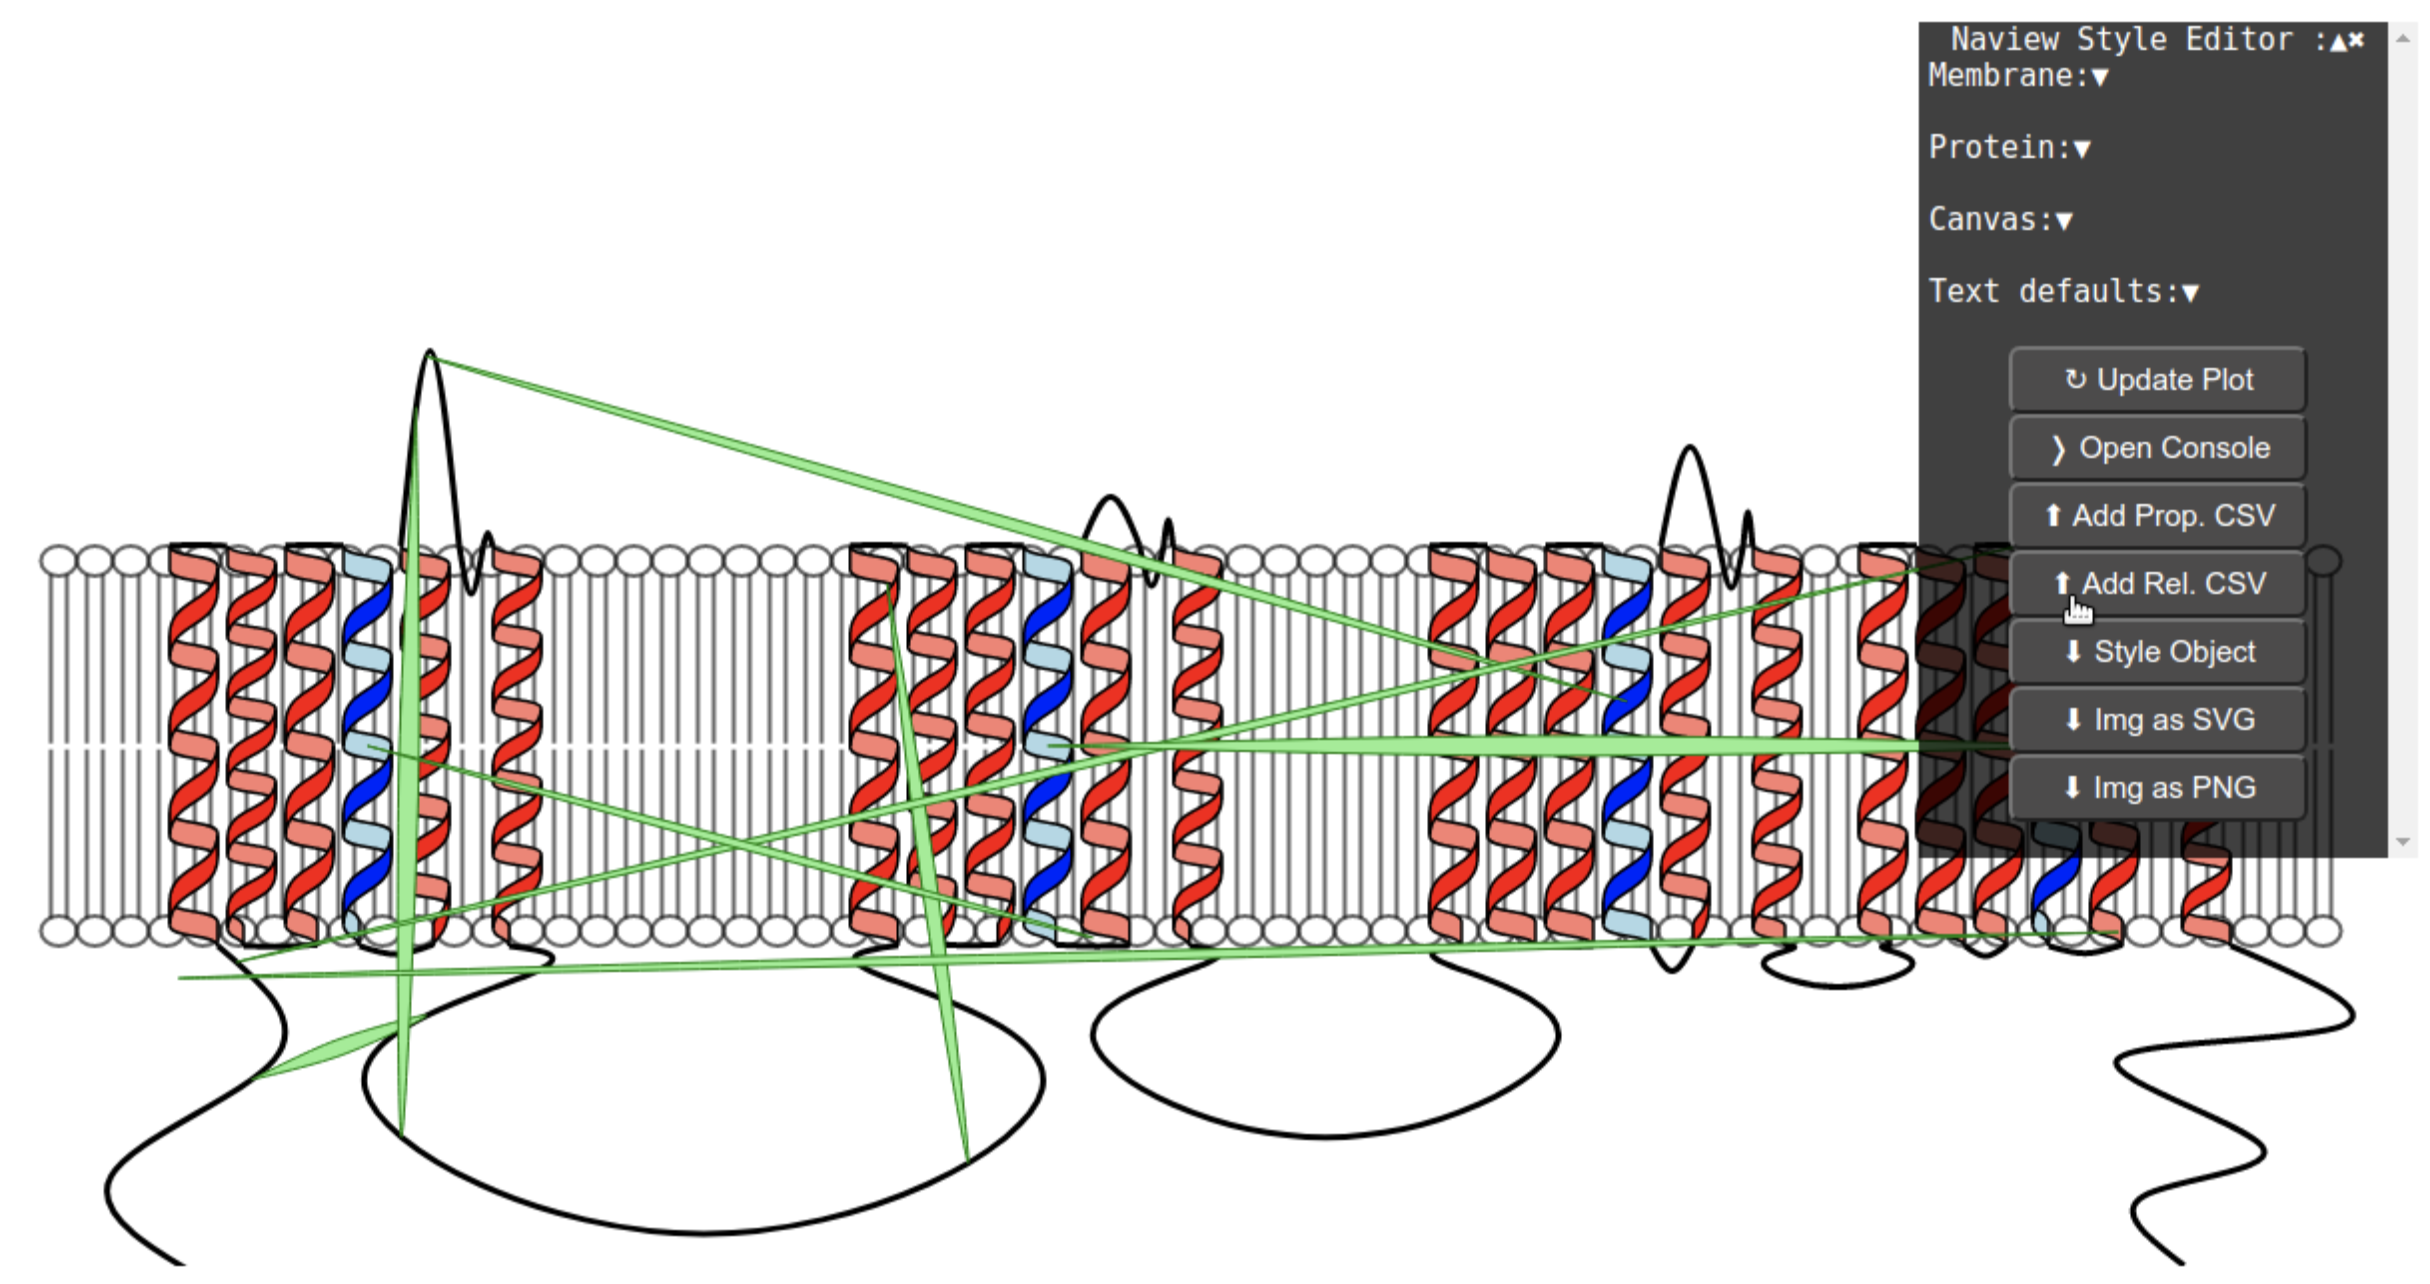
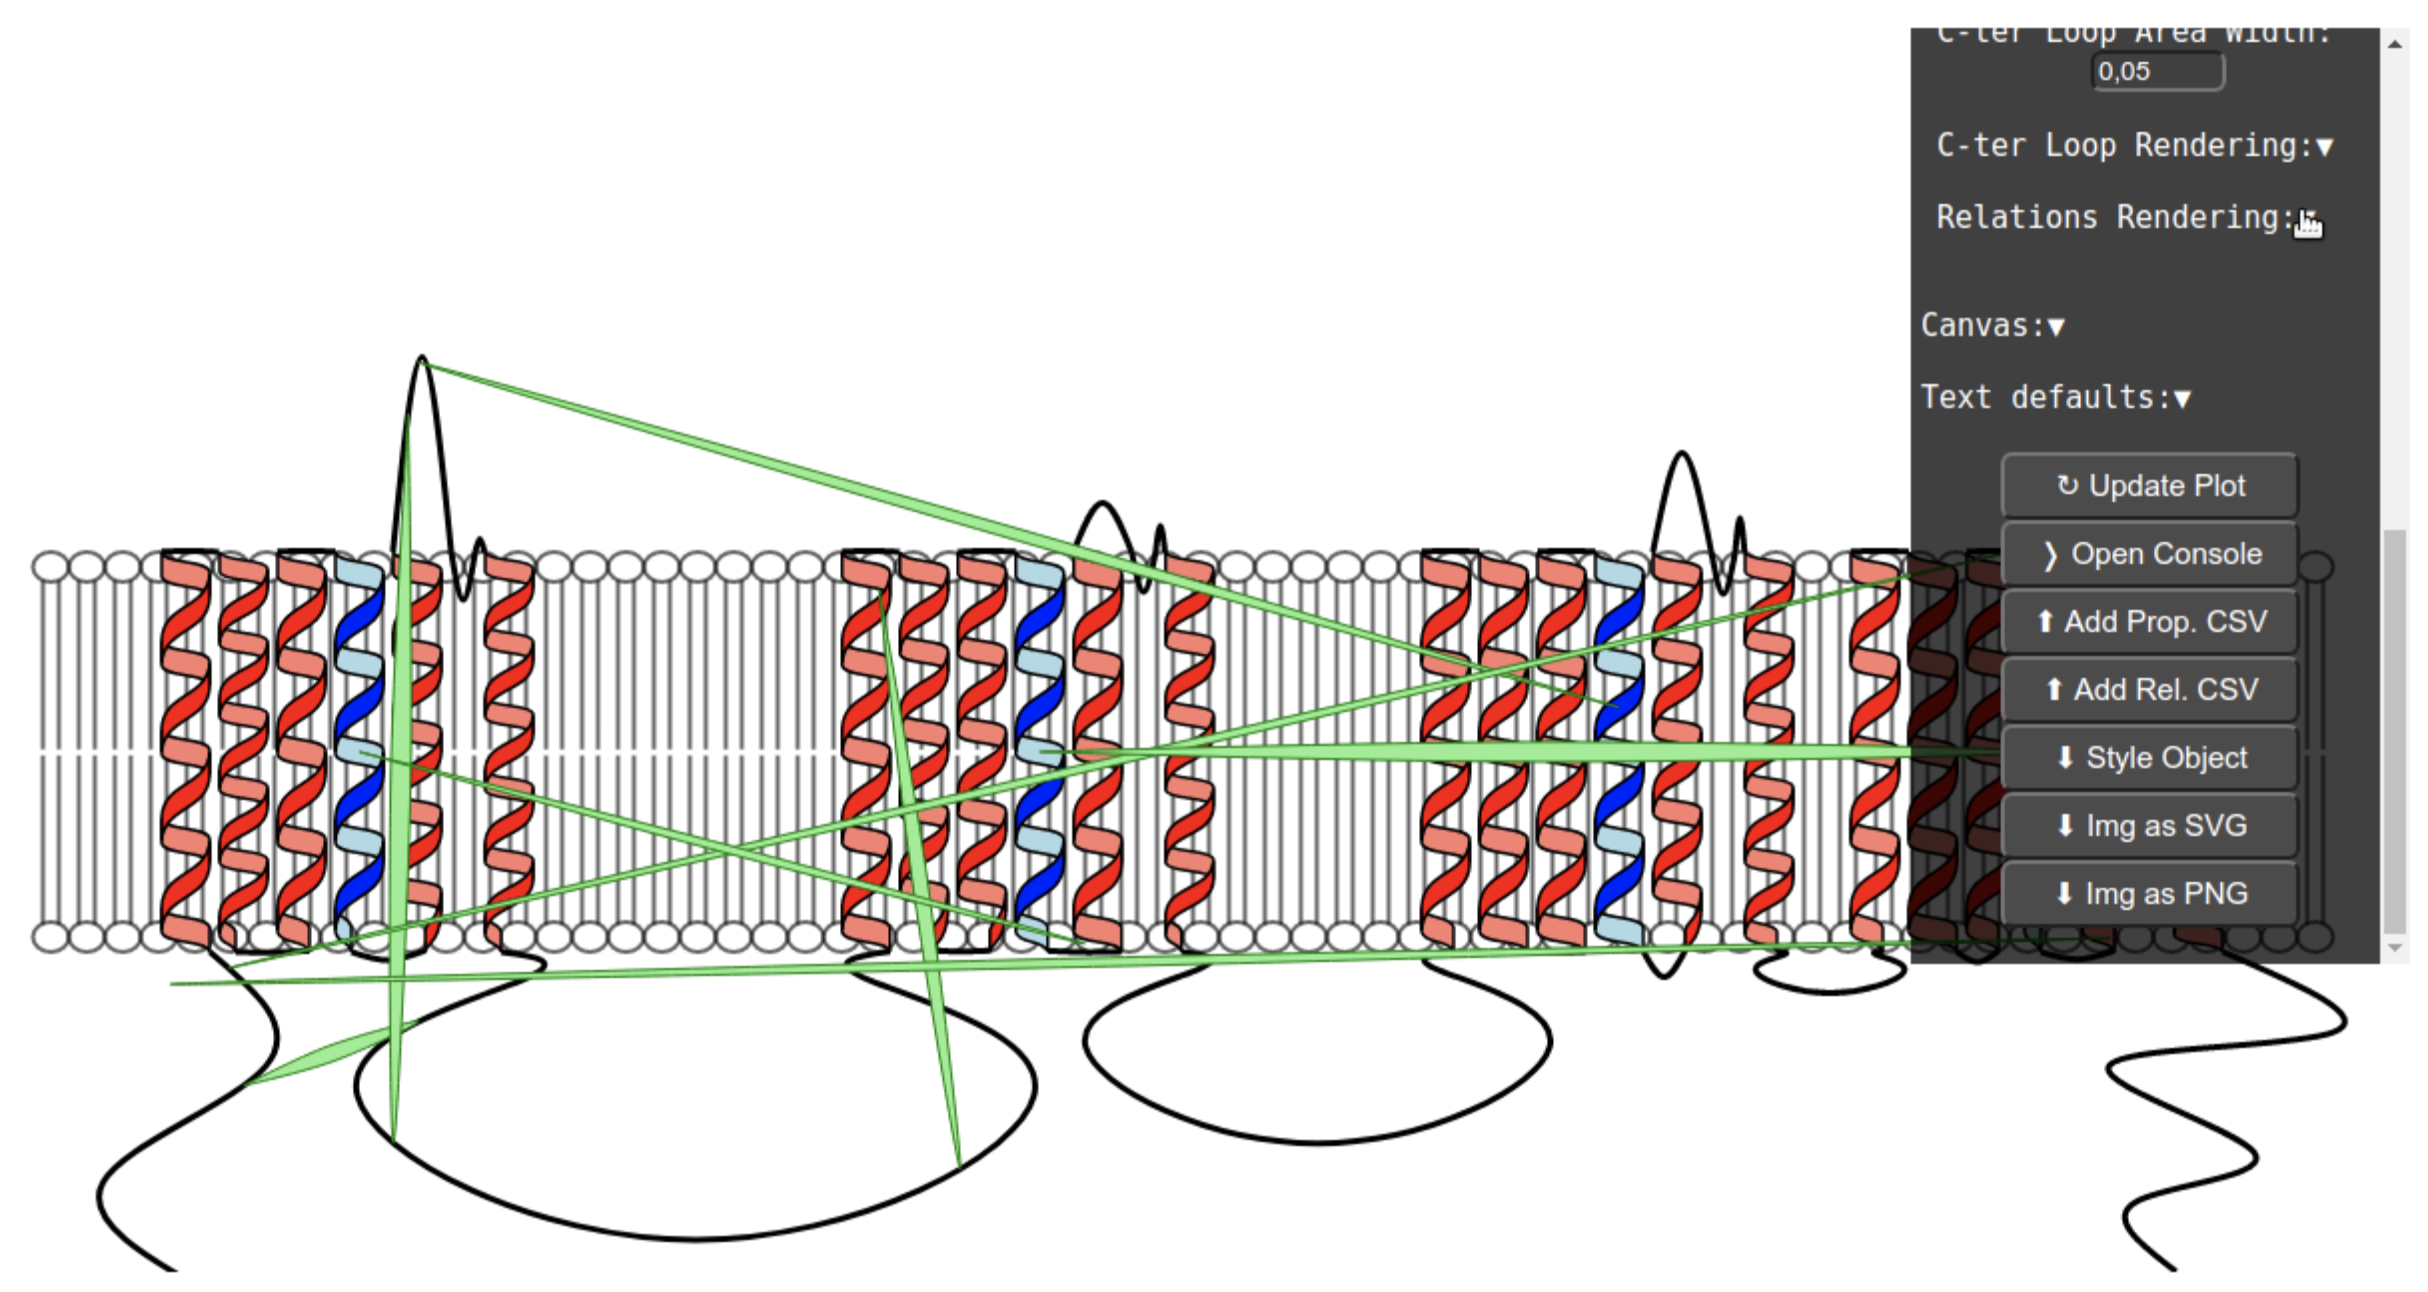
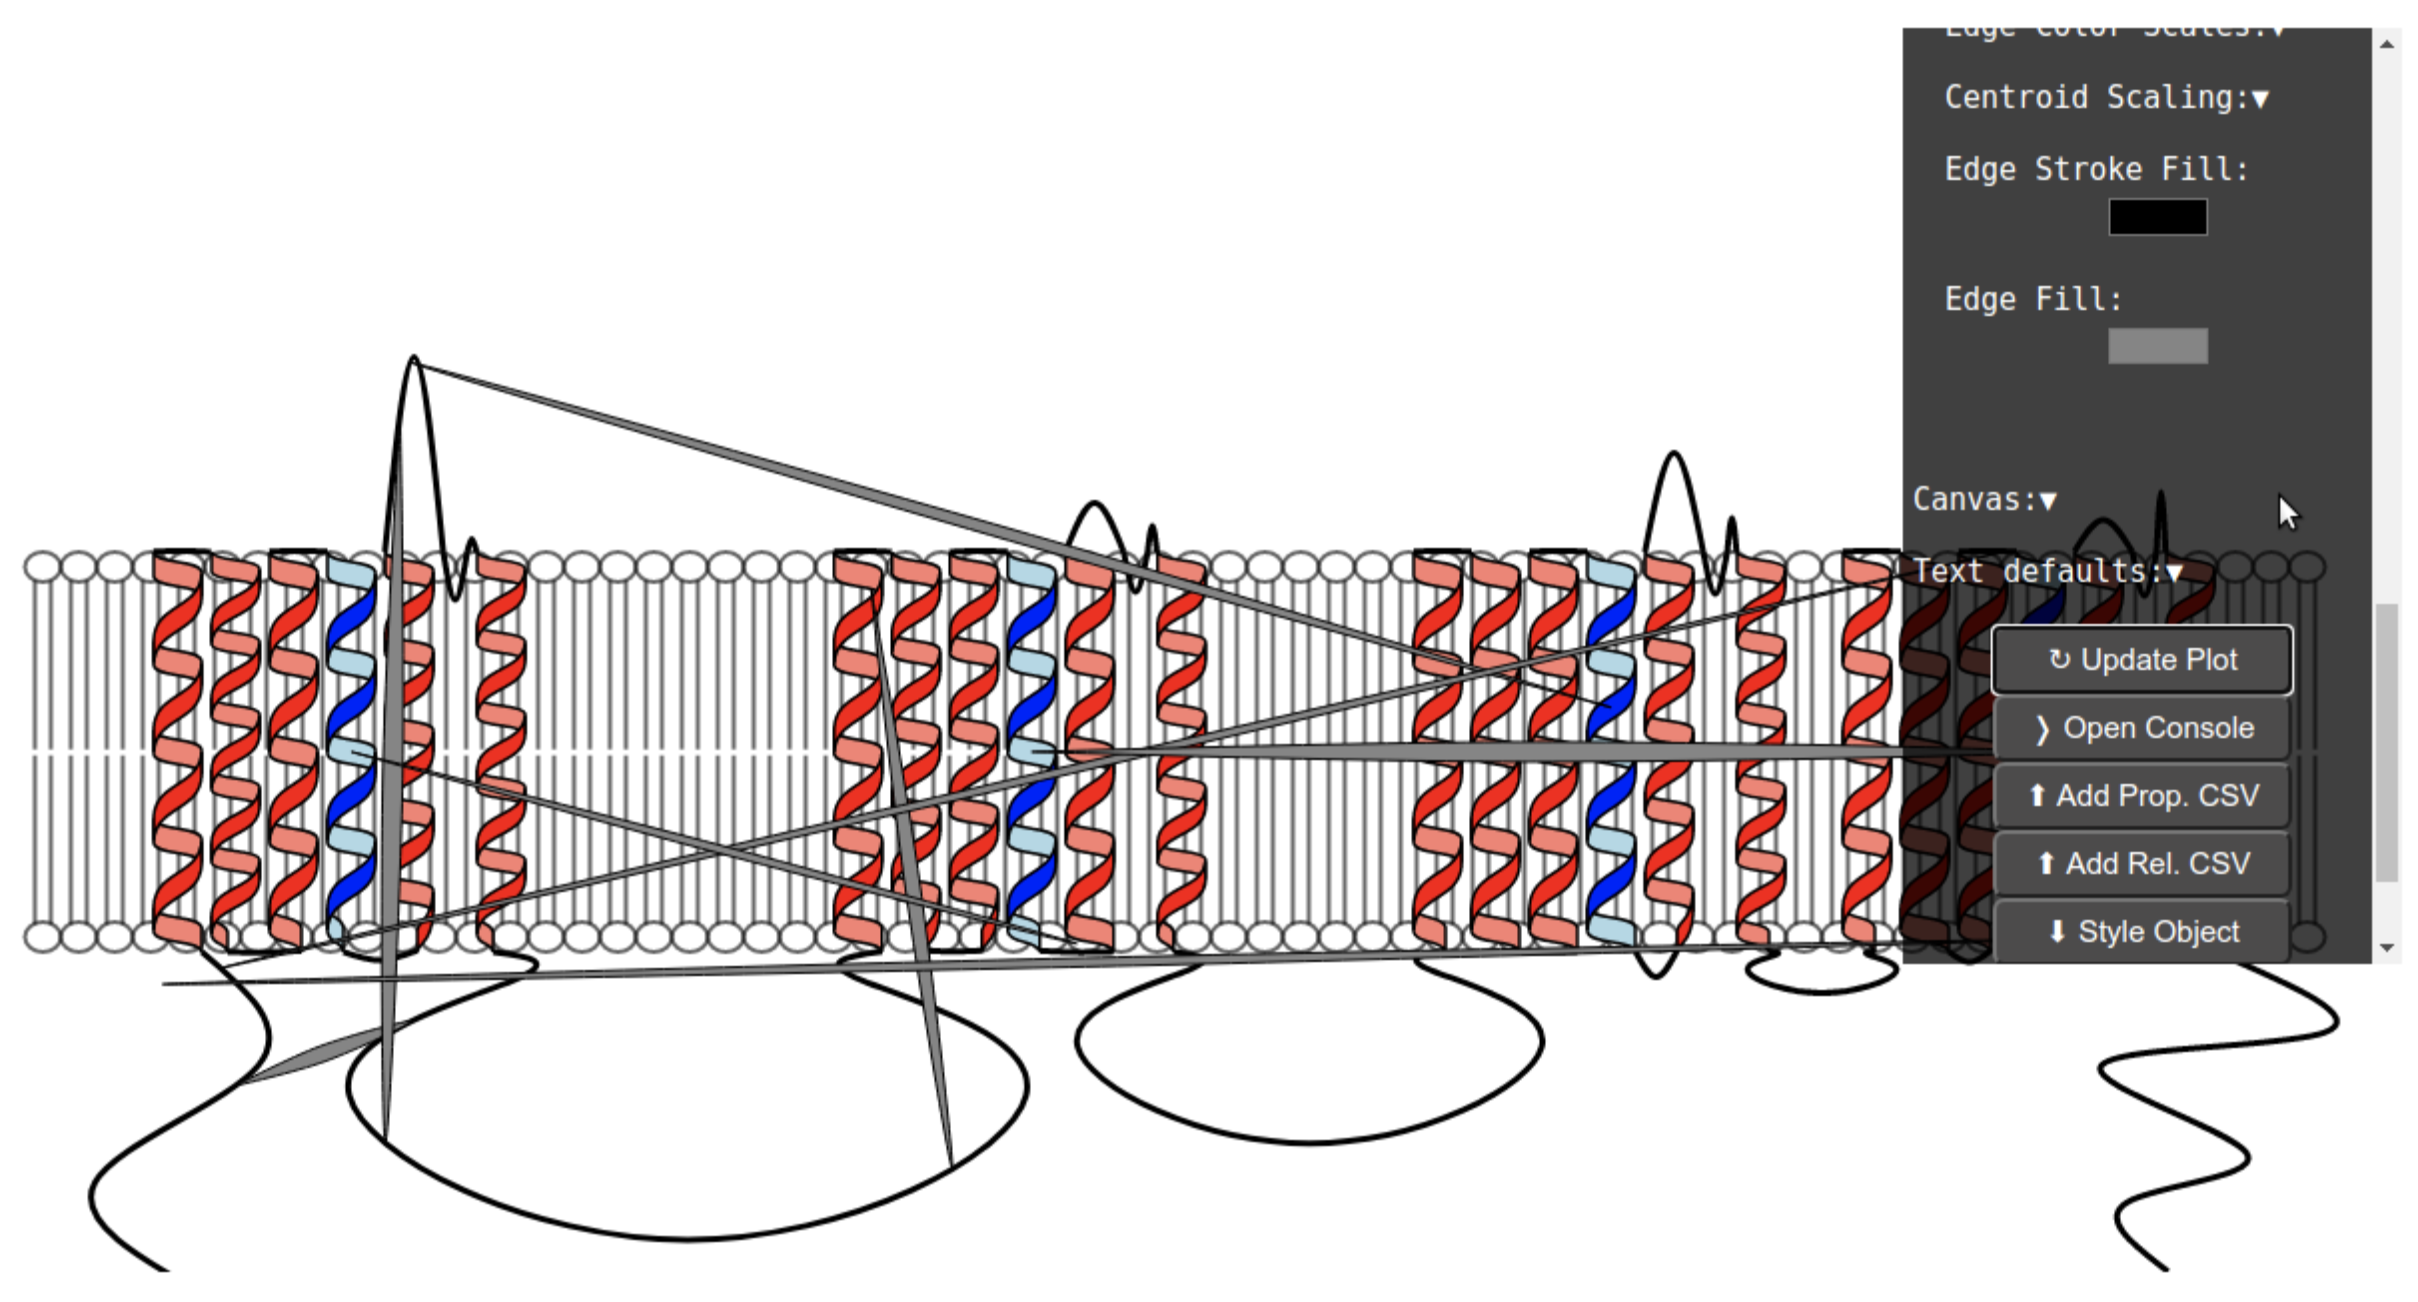
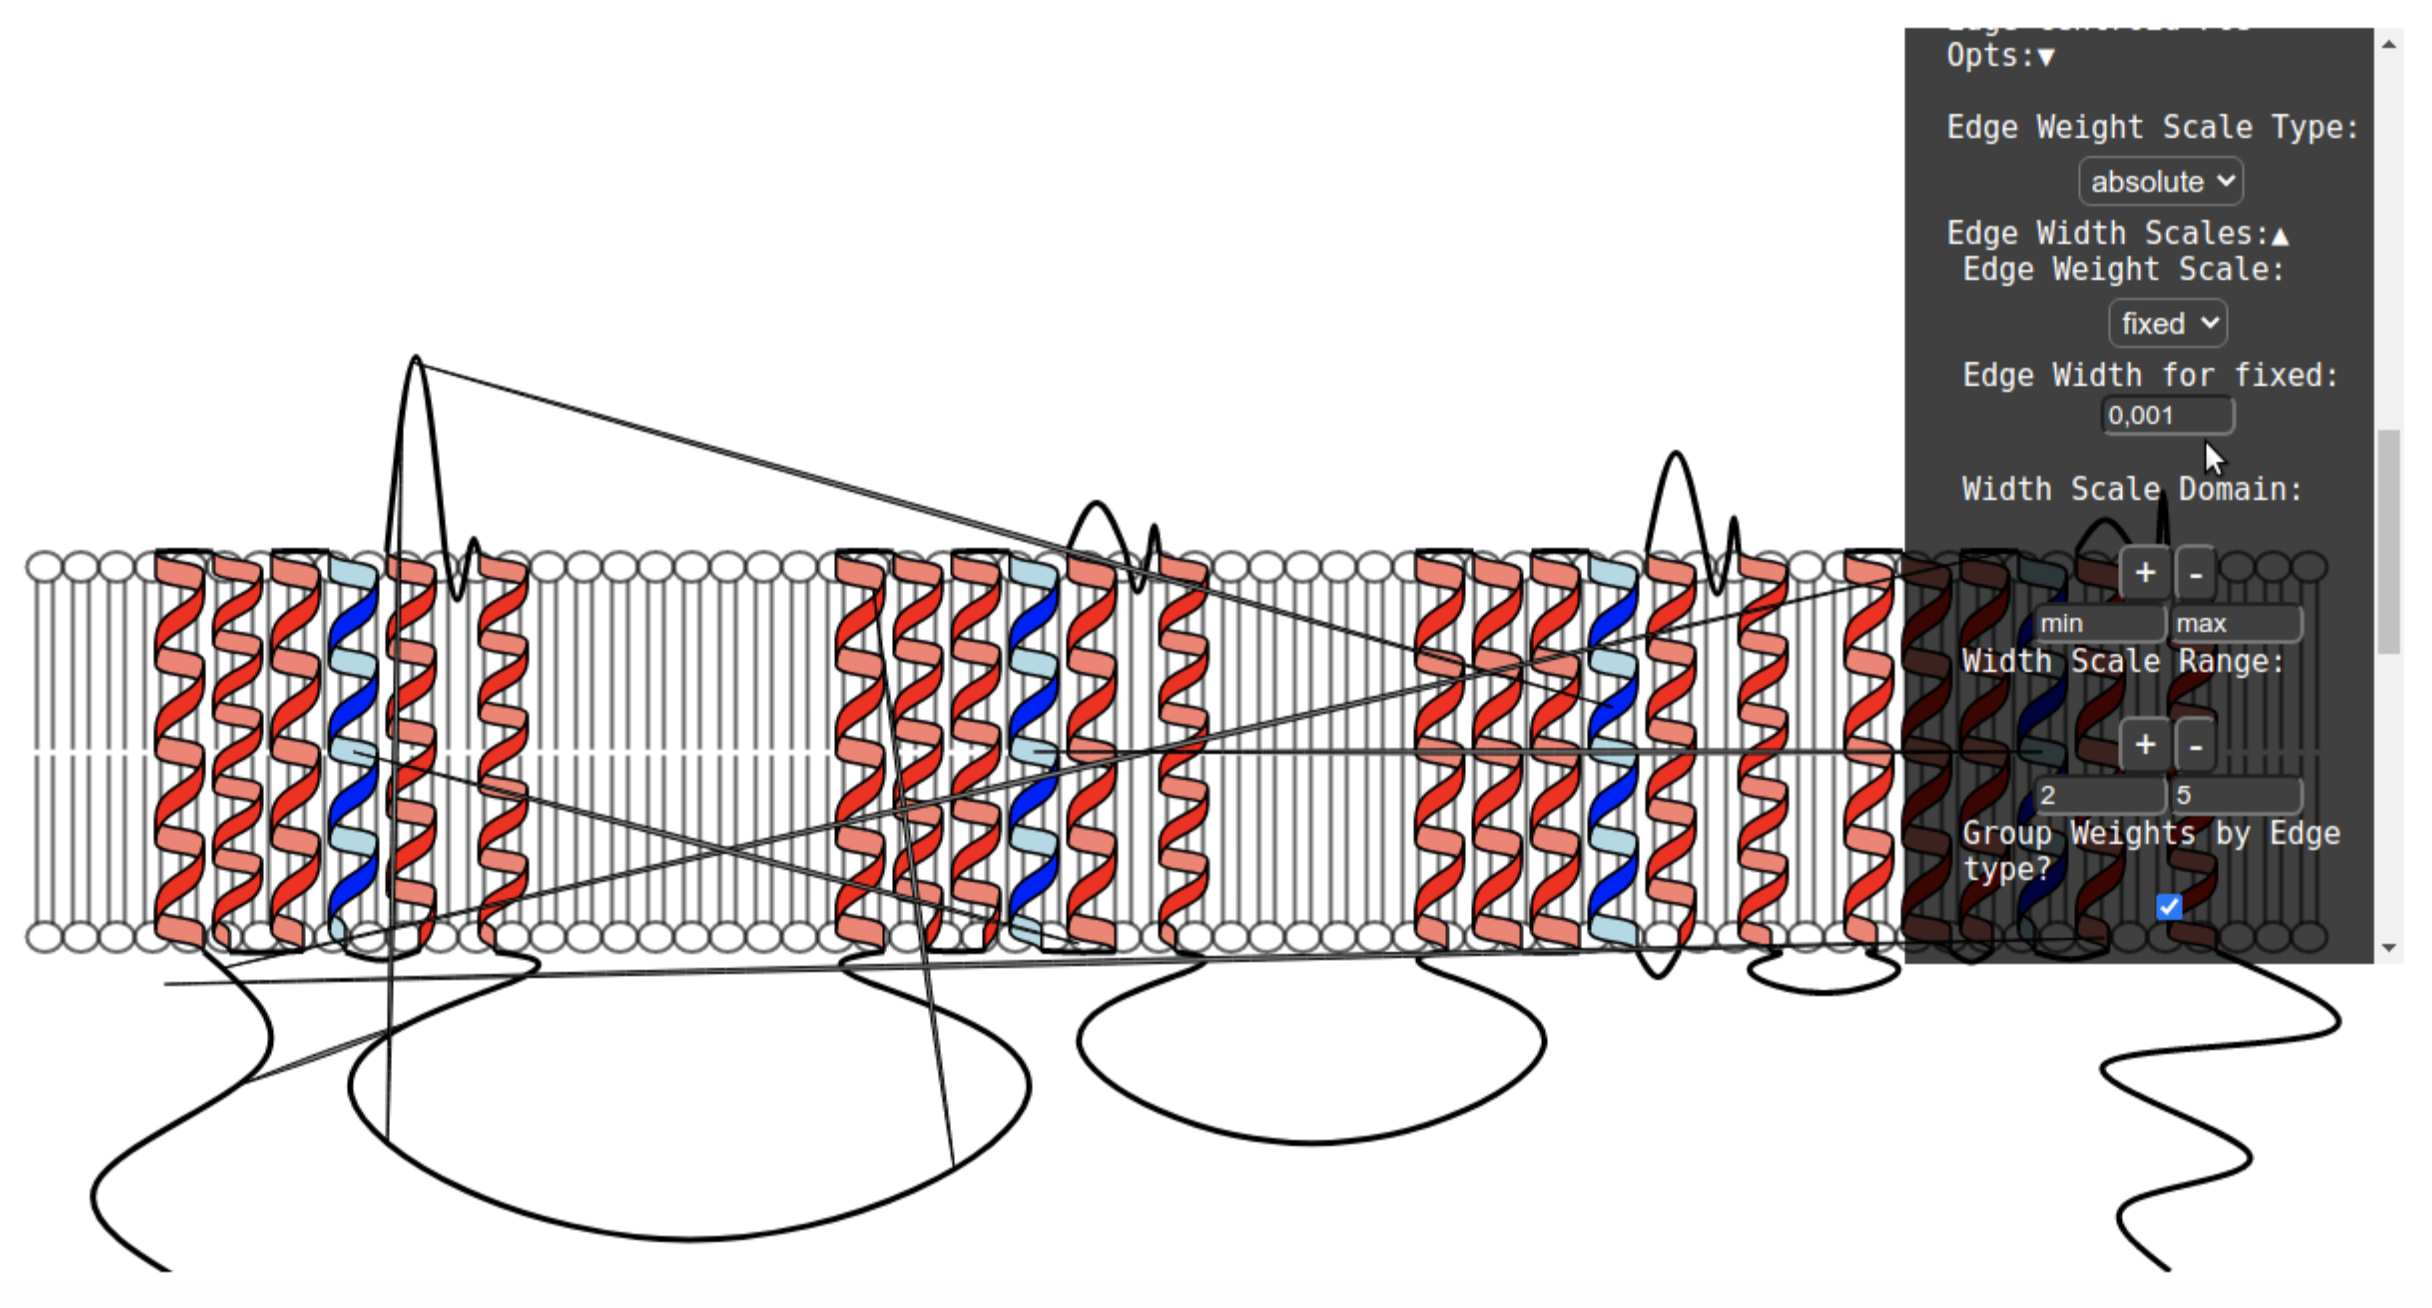
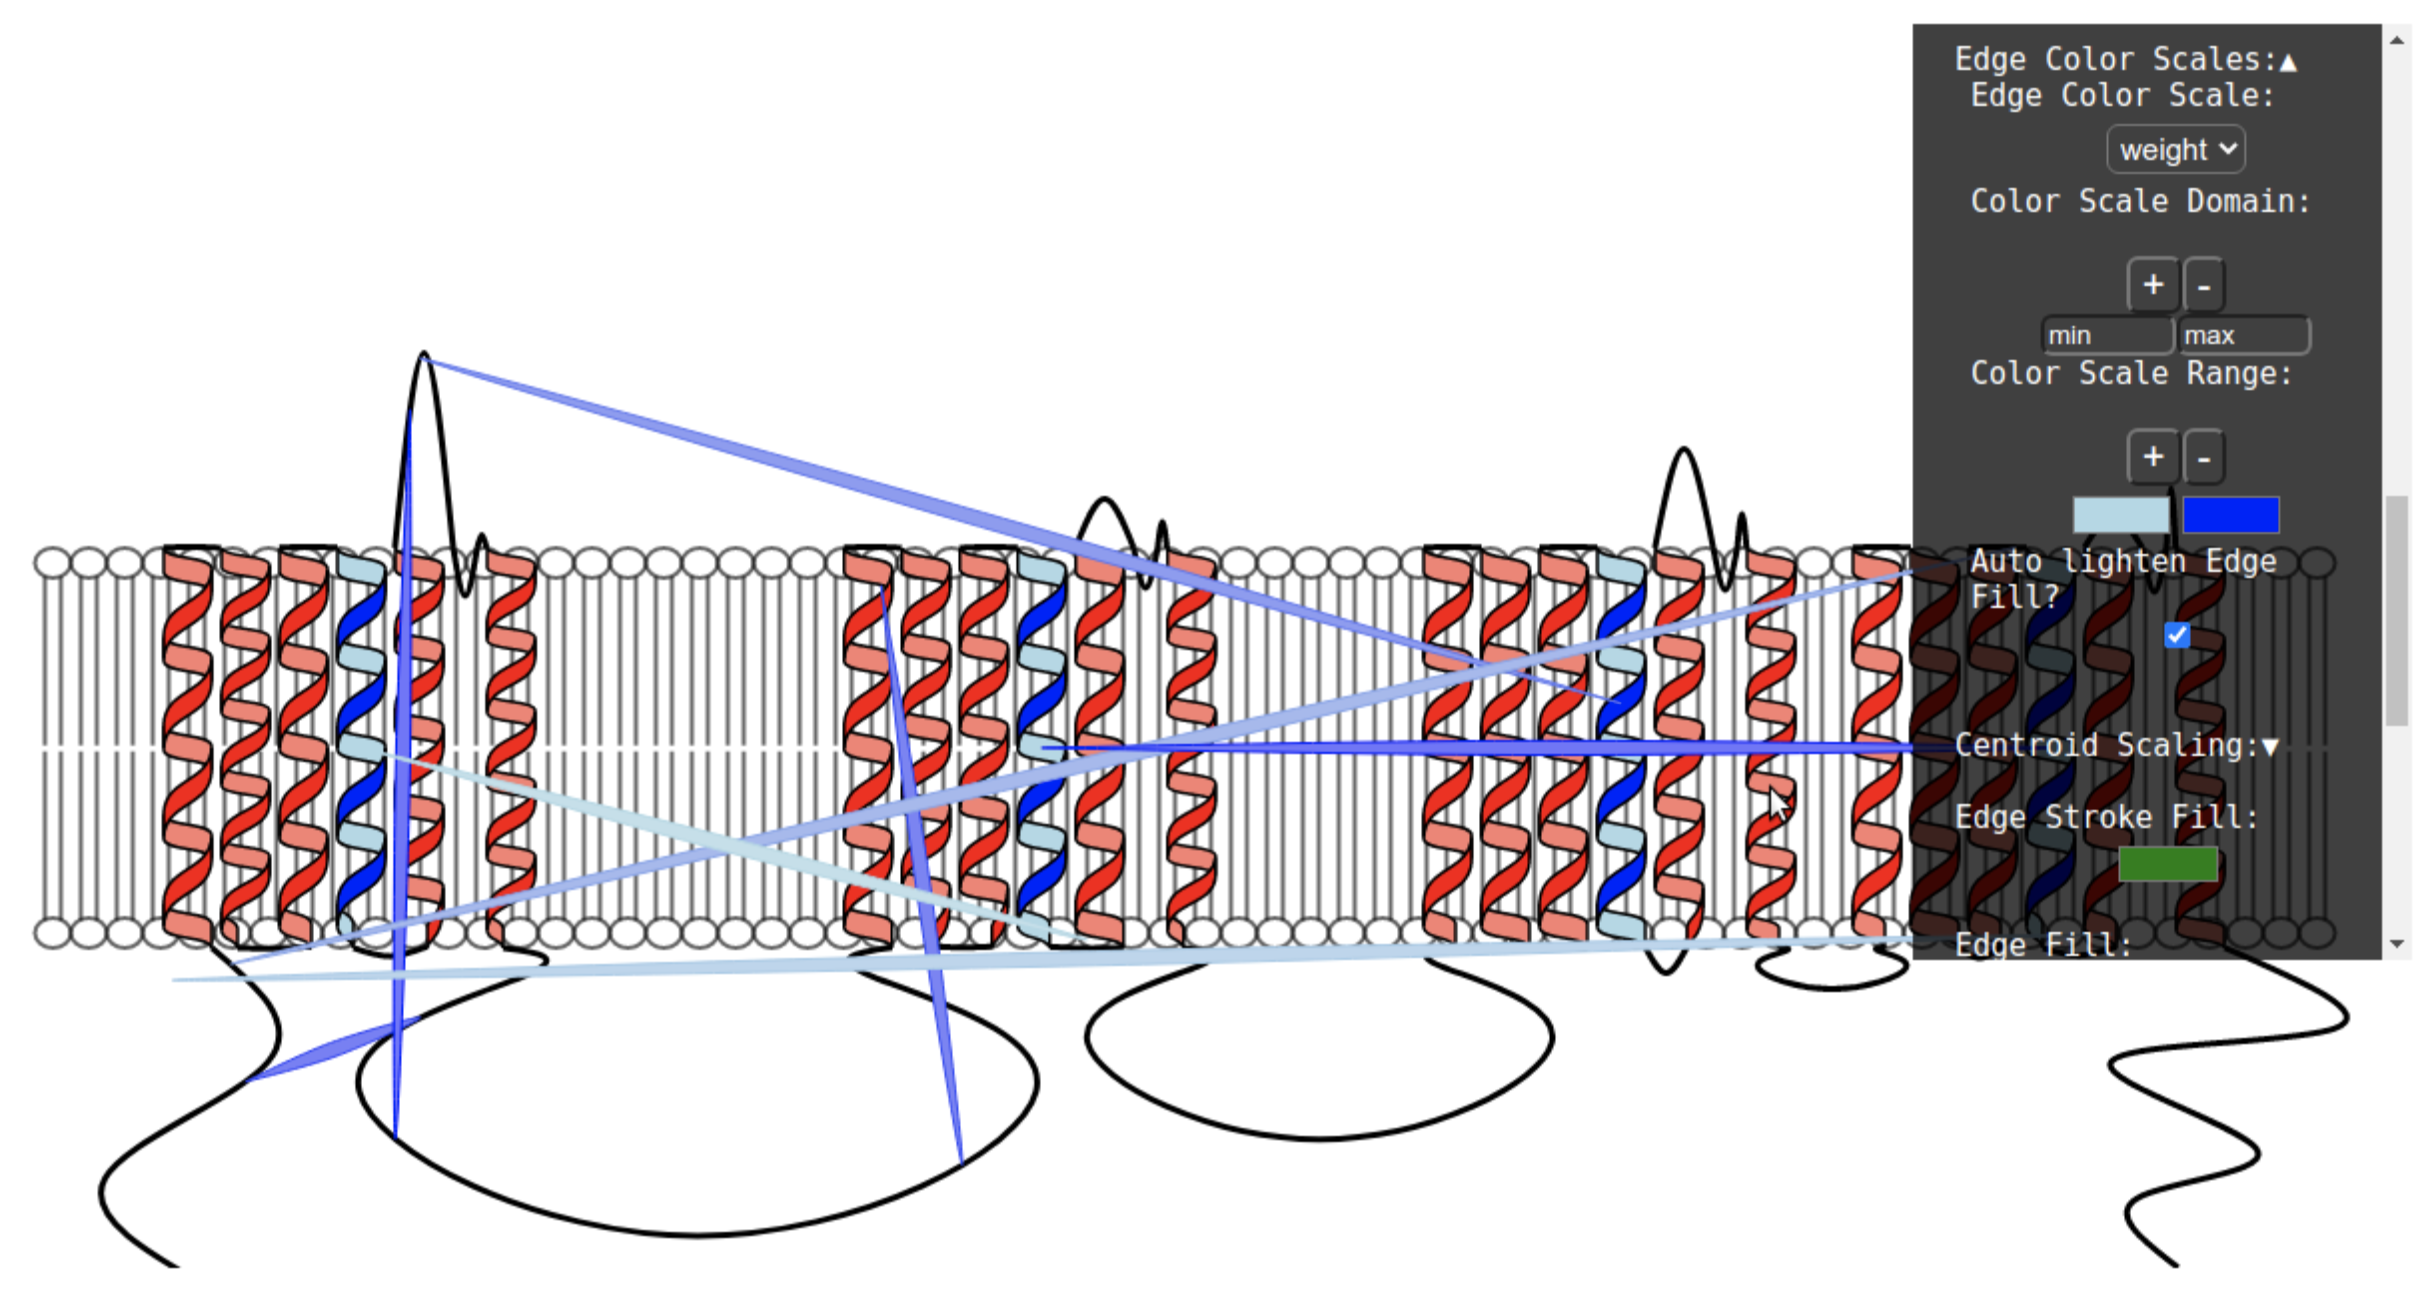
Relationships
Relationships between residues/elements can be displayed in NaView by loading a CSV formatted file through the Style Editor (tutorial here, or programmatically as shown in the code below.